
According to a Recent Study/Survey … End-of-July 2018 Edition
32 Min Read By MRM Staff
This edition of Modern Restaurant Management (MRM) magazine’s “According to …” research roundup features exclusive research on Chick-fil-A’s Dress Like A Cow LTO from Sense360, stories on attracting lapsed guests, wine trends, quiet restaurants, emotional connections to brands and OpenTable’s top Southern restaurants.
Dress Like A Cow Promo Analysis
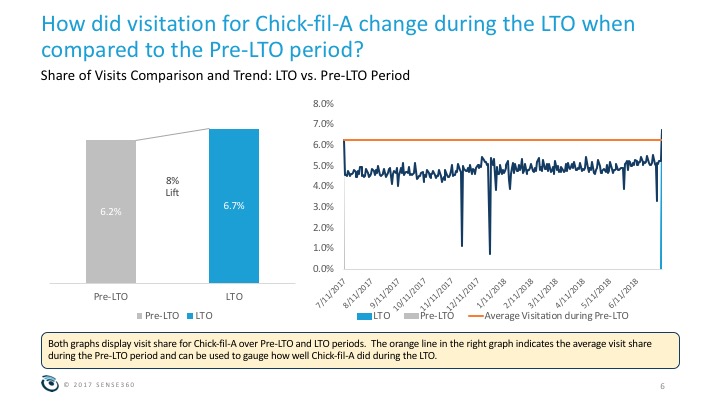
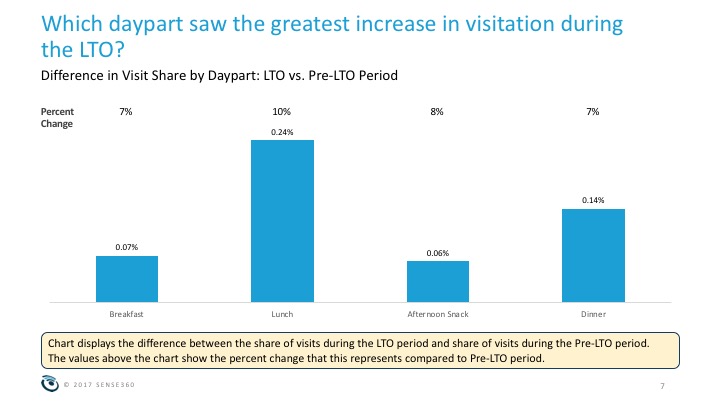
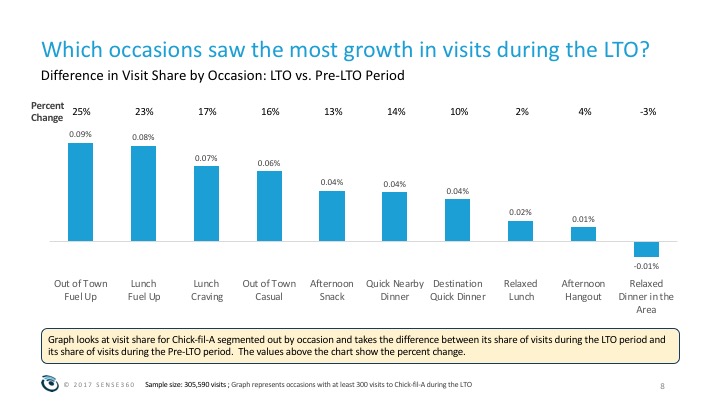
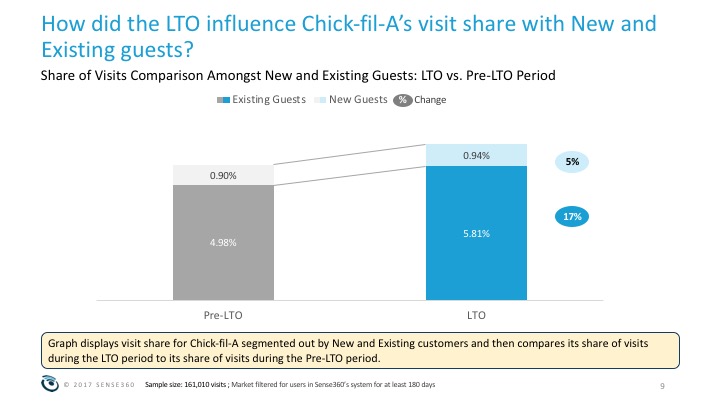
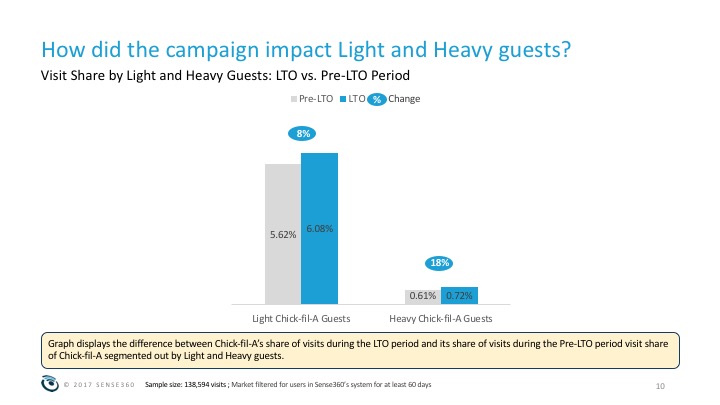
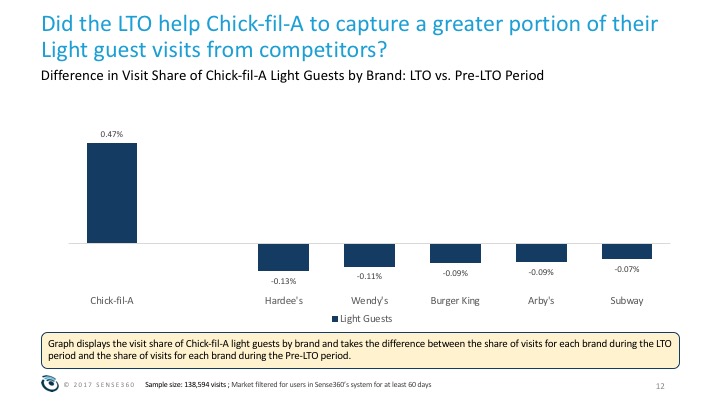
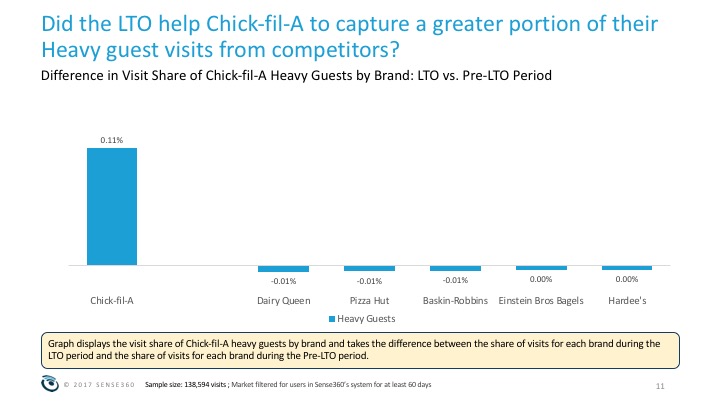
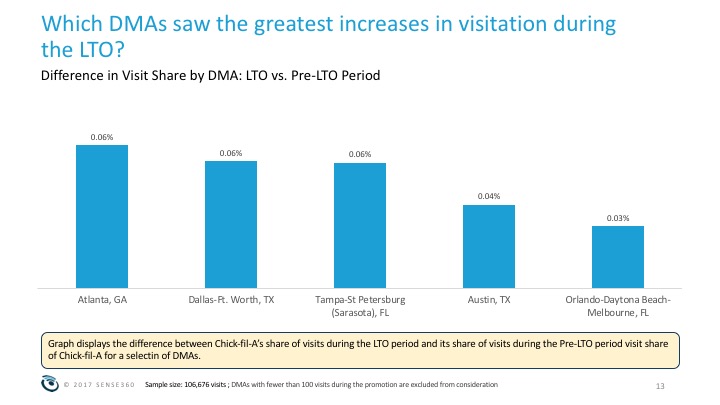
A new report from Sense360 explores the effects of Chick-fil-A’s Dress Like a Cow limited time offer on visitation by observing visit patterns both before and during the campaign and highlighting the differences between the two periods.
Off-Premise Impact
For restaurant operators, providing a great guest experience is no longer just about what happens inside the four walls of their locations. The new paradigm is about having a robust off-premise program for consumers to enjoy their food where they live, work and play. Off premise dining is becoming the “new” dining out, as off-premise sales are estimated to make up almost half of total restaurant sales by 2023. These are a few of the findings from the 2018 Takeout, Delivery and Catering Study, commissioned by Off Premise Insights, a division of Monkey Group, and conducted by CHD Expert. The study examines the off-premise landscape, including a five-year market outlook, provides consumer insights on usage, decision drivers, and order placement dynamics and expectations. It also includes perspectives from restaurant operators on their off-premise programs and catering best practices. Over 3,000 consumers who ordered takeout, delivery or catering within the past month and a number of operators were surveyed and interviewed for this study.
The study is organized into four distinct service channels that comprise off-premise restaurant sales:
- Takeout for pick-up: $124 billion projected sales in 2018
- Takeout with direct delivery from a restaurant: $32 billion
- Takeout with delivery from a third-party marketplace (e.g. GrubHub, Uber Eats): $13 billion
- Catering for pick-up or delivery: $40 billion
“The unprecedented growth in takeout, delivery and catering is being driven by increasing consumer demand for convenience and a rapid advancement in the development of cloud-based ordering technologies and marketplaces,” said Erle Dardick, founder of Off-Premise Insights and CEO of Monkey Group. “It is critically important that restaurant and foodservice operators thoroughly understand the opportunities and threats in this quickly evolving sector in order to succeed with this new operating model. ”
According to Google Trends, consumers are increasingly looking for more convenient options from restaurants, with searches for “delivery” growing over the past five years from about 40 percent to over 75 percent. Consumer interest in catering has seen a similar increase over the same period, with searches for “catering” growing from about 50 percent to over 85 percent. Restaurant operators have seen this consumer interest impact their businesses, as off-premise sales are projected to increase to $209 billion this year with 59 percent of those sales coming from takeout for pick-up, 22 percent from takeout for direct and third-party delivery, and 19 percent from catering.
Awareness and Usage
The study found that within the past 30 days 60 percent of respondents ordered takeout for pickup in a restaurant, 44 percent ordered delivery from a restaurant and nearly 20 percent from a third-party marketplace. Limited service and casual dining restaurants are most salient for traditional takeout and catering occasions, while traditional pizza players continue to dominate the direct delivery space.
Consumers are turning to national chains most often for their off-premise meal ordering, followed by local/regional and independent chains. Over six of every ten takeout/delivery orders are made on impulse versus planned, and almost 50 percent of catering orders are also impulse decisions.
Decision Drivers and Influencers
When choosing where to order from, consumers stated that food quality, price and order accuracy are considered the most important elements, with speed of delivery and on-time accuracy increasing in importance. Nearly two-thirds of respondents indicated they have a “go-to” place for ordering delivery, while 77 percent stated that like being able to place repeat orders from restaurants they like because it makes their ordering process easy and convenient.
Search and Order Dynamics
As it relates to using third party delivery for their takeout & catering meals, 60 percent of consumers surveyed said they use only one app for their search, and most will spend less than 20 minutes searching for their meal with that app. Mobile phones are the most prominent device used to place takeout and catering orders, followed by websites.
Over 80 percent of consumers look for deals and discounts when making their order decision, and a majoritystatedthatreadingrestaurantreviewsareanimportantpartofthedecisionmakingprocess. Easy to use apps are critical as almost 60 percent of respondents indicated they order their food while on the way home via transportation.
Another way for restaurant operators to drive repeat takeout/delivery business is by rewarding customers, as 64 percent of consumers agreed they would order more from restaurants if a loyalty program with rewards was offered.
Consumer Expectations
Survey respondents expect their food to be delivered within 30 minutes of placing their takeout order, with women and consumers over 45 being a bit more patient when it comes to delivery time. The ideal cost of a takeout delivery order is about $17, with males, millennials and boomers willing to spend a little more.
Consumers also reported that the use of high quality packaging that keeps the food at the correct temperature and the appearance and professionalism of the delivery person helps to ensure the integrity of their food delivery. But if something is not right with their order, over 80 percent of consumers stated they would blame the restaurant, and not the third-party delivery company.
Third Party Delivery Providers
GrubHub and UberEats are top of mind among consumers for third party delivery occasions. The study suggests there is a significant opportunity for new customer acquisition by these companies, as 40 percent of respondents said they have yet to use any third-party delivery service.
When it comes to being satisfied with their order experience, among those consumers that have used third party delivery services, almost 80 percent stated they were satisfied with the experience. Third party delivery platforms are considered better than direct restaurant delivery options when it comes to ease of use and convenience, but are lagging in important areas such as affordability, order accuracy, on- time delivery and food quality.
“The expected growth in the off-premise business will trigger a number of changes in the restaurant industry, from changing store layouts to embracing new technologies in ordering platforms and process management,” said Darren Tristano, CEO of CHD North America. “From a consumer standpoint, I expect we may see an openness to new pricing models for takeout and delivery orders, such as surge pricing, and opportunities for new promotional methods such as ‘exclusive delivery only limited time offers’. ”
Catering Insights
Catering is estimated to be a $40 billion business for restaurants in 2018. 16 percent of all off-premise orders are for catering, with12 percent of those orders coming from businesses. Panera, Subway, Chick-fil-A and Pizza Hut are the most top of mind brands for catering pick up orders, while Panera, Olive Garden, Chick-fil-A and Subway are the most salient brands for catering delivery orders.
Global Hospitality Insights
Insights from TripAdvisor’s new “Hospitality Sector Report,” which was released this morning. Developed in partnership with Ipsos MORI, the report analyzes the top priorities and concerns for US travel business owners in 2018 – inclusive of hotels, restaurants, and experiences. In short, the results reveal that owners and operators are increasingly concerned about their online presence as well as choosing the right marketing vehicles to attract global travelers and diners.
A summary of key findings is below for quick reference:
- The mobile market is growing: 87 percent of those surveyed indicated that having a mobile enabled website or app is important.
- The vast majority (97 percent) of owners view online reputation management as essential to their business.
- 98 percent of owners note that online reviews are crucial to business success.
- 89 percent of owners believe in the importance of keeping up with online marketing.
- The majority (89 percent) of owners note that keeping up with online marketing is important, with 80 percent stating that working with the right online marketing service is important.
- The top three areas of focus for hospitality businesses this year are customer service retention (27 percent), staffing (25 percent), and marketing efforts (20 percent).
- When asked what they expected to have a positive impact on the travel industry, the top three forces owners noted were hiring the best staff (43 percent), global economic conditions (30 percent), and overtourism (29 percent).
How to Win Back Lapsed Guests
Paytronix Systems, Inc. released a Data Insights research brief that identifies 80 to 90 days as the key average window for winning back lapsed guests. The report explains how “mitigating the impact of lapsed guests can have a high impact on traffic and same-store sales” and outlines key strategies for getting these guests back to drive incremental revenue. For more info, read Three Things to Know to Win Back Lapsed Guests
“Be careful to only implement a win-back campaign after you’ve taken the time to separate truly lapsed guests, or you’ll be discounting loyal customers who already plan to return,” said Lee Barnes, head of Paytronix Data Insights. “This new brief explains how to separate out truly lapsed guests and identify the window where it’s most effective to engage with them—along with proven strategies to win the customer back.”
The Paytronix research brief outlines the following steps to strategically determine when to send a “we miss you offer” to a guest:
- Track and measure the variability in guest visit frequency;
- Begin with a small offer first, then increase to more valuable offers as guest absences stretch 2-to-3 times their average visit frequency;
- Keep a control group to measure the true impact of the campaign.
“Guest lapsing is a part of life and will happen no matter how great your concept and your loyalty program. Remember, a known lapsed guest is ALWAYS better than an unknown one. If the guest is unknown, you probably won’t even know that they’ve stopped coming in,” said Barnes. “Winning back lapsed guests can significantly impact your restaurant’s sales and traffic, but you can only do this if you know enough about the guest to A) be confident that they’ve lapsed and B) send an offer that resonates with them.”
Specialty Food Trends
Over 200,000 products awaited the Specialty Food Association Trendspotter Panel at the 64th Annual Summer Fancy Food Show. Held June 30 to July 2 at the Jacob Javits Center in New York City, the show encompassed six football fields worth of specialty food and beverages. Members of the panel were armed with predictions from earlier in the year as they tasted their way through the show, confirming some current, and identifying new and emerging trends.
“The specialty food industry has grown to over $140 billion. Innovation is a key growth driver, and we definitely saw that at the Summer Fancy Food Show,” said Denise Purcell, head of content for the Specialty Food Association. “We’re seeing new flavors and new formats of food. Plant-based foods are growing from a trend into an overall movement, and upcycling is huge. Spins on classics continue to surprise us, and flavors from around the world continue to grow prominent in the marketplace. No matter where you look, something exciting is happening.”
The Summer Trendspotter Panel included Melanie Zanoza Bartelme, global food analyst, Mintel; Kenneth Blanchette, quality assurance director, fresh departments, Center of Excellence,FreshDirect; Massimo Bottura, chef and restaurateur, Osteria Francescana; Eleonora Cozzella, writer and lecturer; Jonathan Deutsch, Professor, Center for Food and Hospitality Management and Department of Nutrition Sciences, Drexel University and founder of the Drexel Food Lab; Melina Romero, manager, Trend Practice, CCD Innovation; Kriti Sehgal, CEO, Pure Fare; Stan Sagner, Writer, Marketing & Content Consultant; Alison Tozzi Liu, vice president of marketing, communications, and editorial, James Beard Foundation.
Upcycled Foods
As awareness of food waste broadens, the SFA Trendspotter Panel predicted more products coming to market made with upcycled ingredients—food scraps or leftovers that would otherwise go to waste being repurposed into a new product.
RIND Snacks, Skin-on Superfruit Snacks, using the whole fruit
RISE Products, Whole Barley Super Flour, stone ground whole barley flour hand made from upcycled grain
Williwaw Foods, Salmon Skin Cracklets, made from the skins of salmon from the waters of Patagonia
TBJ Gourmet, Abundantly Good Spiced Tomato Jam, made with tomato tops and bottoms
Cassava Snacks
Plant-based foods are a top 2018 trend, according to the Trendspotter panel, and are visible across categories. At the Summer Fancy Food Show, cassava emerged as a new plant-based snack food.
Jans, Cassava Chips
Nanduto Home Cooking, Cassava Leaves Chips
Coco International, Inc., Popped Cassava Chips
Siete, Cassava Chips
Hidden, or Unexpected, Fruits and Vegetables
Tied to the plant-based and the overall better-for-you trends, producers are blurring the lines in treats and snacks. Options for eating vegetables are even more diverse and fun, with the added value of their nutrients sneaking in as an unexpected ingredient.
Peekaboo Hidden Veggies, organic ice cream in flavors like Chocolate with Hidden Cauliflower, and Strawberry with Hidden Carrot
CAULIPOWER, vegetable-based Baking Mixes
Growers Garden, Broccoli Crisps
Cauliflower
This cruciferous vegetable was another emergence in the plant-based trend. In the quest for the “next kale”, cauliflower has appeared with increasing frequency on restaurant menus. More cauliflower-based packaged products are hitting retail shelves, and are hailed as a carb substitute and beneficial source of vitamins and nutrients.
Halen Brands, From The Ground Up, Cauliflower Pretzels
Hummus Gourmet, Cauliflower Hummus
Cali’flour Foods, Cauliflower Wrap
Flavors of Africa
The SFA Trendspotter Panel pointed to regional Middle Eastern foods as growing in prominence. This remains true, however notable products at the Summer Fancy Food Show indicate that flavors from Africa are gaining notice, and establishing more of a presence in the mainstream marketplace.
Ahara Rasa, Niter Kibbeh – Ethiopian Spiced Ghee
International Delicacies, KITCHEN & LOVE, Stir and Go Quick Meals in Moroccan Vegetable Harissa
Ginjan Bros., Ginjan, a traditional West African ginger juice made with ginger, cold-pressed pineapple, lemons, vanilla, anise, and cane sugar
Ayoba-Yo, South African-style biltong, a dried, cured meat that originated in Botswana, South Africa, Zimbabwe, and Namibia. This version uses grass-fed beef that is air dried and seasoned
Manitou Trading Company, Senegalese Fonio Pilaf, fonio with a Yassa spice blend
Sparkling Beverages
According to SFA research, The State of the Specialty Food Industry 2018, beverage categories collectively have grown 18 percent in retail sales between 2015 and 2017—faster than food categories. Sparkling beverages, particularly, were prevalent at the show and have been gaining prominence as alternatives to soda, mixers for cocktails, as well as cocktail alternatives altogether.
TÖST, Dry Sparkling Beverage
Jax Coco,Sparkling Coconut Waters
Caskai,Sparkling Cascara Infusion
Kimino Drinks, SparklingYuzu
O.Vine, Wine-Grape Infused Water
Sustainability-Minded Products
Producers continue to bring products to market that incorporate principles of sustainability, and environmental and ethical awareness.
OneForNeptune, White Fish Jerky, sustainably sourced and uses the offcuts from whitefish processing
Ocean Hugger Foods,Ahimi, a tomato-based tuna substitute for sushi created as a response to overfishing for tuna
Farmtrue, Ghee-Nut Butter, nut spreads that use ghee-clarified butter in place of palm oil, which has been linked with deforestation.
2018 SFA Trendspotter panel predictions that are ramping up in packaged foods.
Cannabis cuisine was noted by the Trendspotters as trend that would emerge in 2018. We are starting to see the beginning in beverages and snacks in the specialty food arena, notably with products like Vera Roasting Wellness Blend CoffVee, which are organic beans infused with CBD sourced from organically grown hemp, in addition to heart-healthy resveratrol.
Collagen-infused foods. Eating for beauty is an emerging trend and collagen is becoming a go-to ingredient in foods and beverages to replace diminishing levels as consumers age. The Cali’Flour wrap mentioned above contains collagen protein, and Vermont Village Organic Beauty Boost Functional Vinegar is a combination of raw and organic apple cider vinegar mixed with cherry juice and lime juice and spiked with collagen. The panel expects to see more collagen snacks and beverages hit the market.
Foods from the Philippines. Another 2018 Trendspotter pick, while more Filipino cuisine is being added to menus in foodservice, we’re also seeing more packaged products using authentic ingredients and flavors. Mansi exhibited Calamansi Juice, made from a small round citrus fruit that’s ubiquitous in the Philippines, and CJC Pit Barbecue is selling its Lechon sauce, a traditional sauce made from pork liver, vinegar, breadcrumbs, and spices.
The following trends emerged at the Summer Fancy Food Show:
Single-Serve Condiment Pouches
Packaging innovations for on-the-go eating are becoming more prominent.
La Tourangelle, avocado oil
Epicurean Butter, finishing butter
Spread Delights, hazelnut spread
Little Bird Kitchen, Fire Syrup, a simple syrup infused with jalapeño
Egg Protein
The familiar and humble egg is becoming a hero ingredient, delivering protein without carbs with mainstream appeal.
Bantam Bagels, Egg Bites, scrambled egg-filled bagel bites in Original, Onion Gruyere, Chipotle, and Veggie flavors.
Vital Farms, Pasture-Raised Hard Boiled Eggs, two refrigerated eggs for on-the-go eating.
Eggurt, probiotic yogurt drink made from pasteurized egg whites—a good source of protein that is gluten-, soy-, and dairy-free.
Spicy and Infused Maple Syrup
Maple syrups infused with spices and teas are starting to pop up. Examples:
Black Shank, Spicy Maple Syrup—Wasabi
Runamok Maple, Jasmine Tea-Infused Maple Syrup
2018 Social Intelligence Report: Restaurants
Social Intelligence
NetBase released its 2018 Social Intelligence Report: Restaurants. The report leveraged NetBase’s social analytics technology to analyze the restaurant industry to identify key demographics, trends and issues. The report then provides concrete examples of brands utilizing social media to outflank competition, improve customer service, and measure their success.
Four of the most interesting insights include: .
- Panera Bread had the highest average sentiment, while McDonald’s had the lowest.
- Approximately 53 percent of 18 to 34-year-olds say online reviews play an important role in their dining decisions.
- 86 percent of people hesitate to purchase from a business that has negative online reviews.
- Negative reviews in Google Search may cost you 70 percent of potential customers.
World Cup Pub Engagement
Yext released new research into the economy of sport in England, showing pub engagement surging 320 percent on July 5th, following England’s penalty shootout success.
Measuring the online behaviours of UK-based pub goers throughout the FIFA World Cup 2018, the findings challenge popular notions of the archetypal England fan, proving consumers co-ordinated where they wanted to watch the next match at least 24 hours in advance.
For instance on July 10th, a day ahead of the semi-final against Croatia, pubs experienced a 97 percent increase in engagement. A startling contrast to the actual match day, July 11th, where pubs experienced 24 percent less engagement.
The study, conducted among 155 individual pubs powered by Yext across the UK, analysed the total number of actions (such as ‘Get Directions’ clicks, ‘Click to Call’ interactions, and clicks to pub websites from search) each pub received and user engagement, calculated by looking at the total number of actions divided by the number of times each location was seen online.
Opening round
Despite predictions this would be a tournament watched from home, engagement during the first week of the World Cup rose on average by 31 percent compared to the pre-World Cup period. Compared to non-match days, the pub set experienced 465 more actions or ‘clicks’ per day through the Group Stages.
As the competition went on, pubs would have become increasingly aware of more traffic directed their way online. In particular, Germany and Brazil matches drove consumer excitement with the final matches played by each team generating up to approximately 6,000 actions across the pub set.
Last orders
Once England was knocked out of the World Cup, pubs across the country experienced consistently less engagement day by day. This came to a head on July 15th, the day of the final, where engagement dropped by 28 percent to its pre-World Cup level.
“England fans drove a major boom in online engagement and in-person business to pubs during the World Cup; and then, as quickly as they came, World Cup pub-goers were gone after the final and traffic was back to its normal levels,” said Jon Buss, MD UK and Northern Europe at Yext. “England fans performed in-depth online research on where to go to watch matches throughout the tournament, checking key business information — such as opening hours, location and menu items. For businesses to capture opportunities like this, they need to make sure this digital knowledge is up-to-date and correct.”
Boom in reviews
Football fans are also a vocal market. Over the course of the competition, customers left 1,550 more reviews per day across the entire pub set when compared with pre-tournament levels. This is equivalent to 49,600 more reviews than an equivalent period before the World Cup.
As England’s World Cup approached its climax in the semi-finals, there was a boom in consumers sharing their opinions of their experiences at pubs, generating 6,820 more reviews on July 10th with an average review rating of 3.9, lower than the average 4.1 rating given before the World Cup.
Buss concluded, “Reviews are an integral part of the decision-making journey we embark on as consumers. Not only are they vital in fuelling the revenue stream, they can be very useful insight tools, informing the business about which elements of the experience work and which need attention. Having one view, and being able to manage the authenticity of reviews, are the keys publicans need.”
Get Appy
A new report titled Get Appy: Do Consumers Use Restaurant & Hotel Branded Apps revealed that a majority of global consumers (57 percent) have used or are using mobile applications to engage with hospitality operators. The study of 15,000 consumers across Europe, Latin America, Asia-Pacific and North America revealed that of the 23 percent that have at least one restaurant or hotel branded app on their mobile device, 70 percent are using them at least once a week. Increased app engagement across global consumers creates new opportunities to personalize service, incentives and menu offerings and highlights the need for modern food and beverage technology to deliver more meaningful guest experiences.
“Consumers are willing to engage with brands through mobile applications if operators can deliver differentiated value,” said Chris Adams, vice president strategy, Oracle Food and Beverage. “Operators that lean into the mobile opportunity for the food and beverage industry will have a significant competitive advantage with greater insight into service preferences and emerging menu trends.”
Of the 23 percent of consumers who have download a restaurant or hotel app, two-thirds have more than three apps on their devices.
Asia Pacific leads with 82 percent of consumers using a hospitality app at least once a week compared to 54 percent of consumers in North America.
One in five global consumers has at least one app for a food delivery service and 23 percent have a booking app for hotels or restaurants on their device.
Almost a third (28 percent) of consumers have paid for food and drink from an app on their mobile device at least once with increased adoption among Asia-Pacific consumers (37 percent)
“Historically development of food and beverage applications has been cost and labor prohibitive for a majority of the marketplace,” said Chris Adams, vice president strategy, Oracle Food and Beverage. “With a modern, cloud-based POS system operators can extend their investment and take control of guest relationships while encouraging long-term loyalty with personalized incentives through an integrated mobile experience.
Clean Meat Trends
New research indicates that two-thirds of Americans are willing to try meat grown from cells without slaughtering animals. The survey of nearly 1,200 consumers, which was led by the nonprofit research organization Faunalytics with support from The Good Food Institute, also found that more than half believed clean meat would be healthy, safe, and environmentally friendlier than conventional meat, while looking and tasting the same. A majority of respondents were also interested in replacing conventional meat with clean meat, with 40 percent willing to pay a premium for clean meat.
Only a quarter of consumers were initially familiar with clean meat. During the survey, each respondent was given one of four messages with different content: The first group received a message outlining how clean meat is natural; the second group read about how conventionally-produced meat is unnatural; the third group received a message that naturalness isn’t important; and the fourth group was shown a message similar to what companies are currently using – the benefits that clean meat offers for people, animals, and the environment.
Compared to past studies that did not provide consumers with information about the positive aspects of clean meat, each of these four messages increased consumers’ interest in eating it. A previous study surveying potential consumers found that 32 percent of Americans would be willing to replace conventional meat with clean meat and that 33 percent would be willing to eat it regularly (Wilks & Phillips, 2017). With the messaging in Faunalytics’ study and the use of “clean meat” instead of “in vitro meat,” these numbers were substantially higher: 53 percent said they would eat it as a replacement for conventional meat, while 46 percent would eat it regularly.
Many consumers reported being willing to pay more for clean meat than for conventional meat. For beef, 14 percent percent of respondents were willing to pay a premium of 25 percent or more. Twenty-five percent were willing to pay a premium up to 24.9 percent. For chicken, 22 percent of respondents were willing to pay premiums of 25 percent or more, and a similar number for fish. Nineteen percent were willing to pay a premium up to 24.9 percent for each.
This willingness to pay more for clean meat was particularly true of people who learned about the unnatural aspects of conventional meat, such as the use of antibiotics and hormones, unsanitary farming conditions, and the unnatural rate of growth of farmed animals. Almost half of the people who read that message were willing to pay more for clean meat than conventional meat (47 percent) versus only 38 percent of those who read a more general message.
“We are happy to see research into how consumers feel about our field. Transparency and consumer education are part of our core principles. We believe that as consumers learn more about our products, they will become more excited to bring these products to the dinner table,” explains Steve Myrick, VP of Operations at Memphis Meats.
“Any concern about clean meat consumer acceptance is really unnecessary,” notes Bruce Friedrich, executive director and co-founder of The Good Food Institute, which promotes clean meat and works with clean meat companies on regulatory and scientific cooperation. “Even in this very short survey, accurately describing clean meat and talking about its benefits convinced consumers that it’s a product they want to consume – in a real-world scenario, these numbers should be even better.”
The complete research report, additional analysis, and infographics are available at no charge at faunalytics.org/clean-meat.
Quiet List
SoundPrint recently launched crowdsourcing app that allows people to search for and rate the noise level in restaurants, bars and cafes, has announced its proprietary “SoundPrint Certified Quiet List” of New York City venues in time for NYC Restaurant Week, which runs through August 17.
Available nationwide, SoundPrint allows you to “Find Your Quiet Place” for a date, business meeting or an intimate conversation with friends and family. The SoundPrint app features a decibel meter for users to measure the noise level of an establishment and submit the results to the SoundPrint database. Users can also post comments about the atmosphere. The app rates sound levels as: Quiet, Moderate, Loud and Very Loud.
To be eligible for the SoundPrint Certified Quiet List, restaurants must have multiple user submissions at the Quiet or Moderate noise level (75 dBA or lower) during peak days and hours.
The current list of SoundPrint Certified Quiet Spots includes restaurants such as Brasserie 8 ½, Grifone, il Tinello, Junoon, Peking Duckhouse, Radiance Tea House, Scalini Fedili, Tocqueville, Triomphe and 212 Steakhouse. The entire list can be viewed at https://www.soundprint.co/quiet-lists/nyc/.
Founder Gregory Scott, a New Yorker with hearing loss, created the app after finding it increasingly difficult to find quieter venues where he could hear his dinner dates. He searched existing noise level reviews and found them to be subjective and highly inaccurate. “The SoundPrint Certified Quiet List was created to give restaurant patrons an easily accessible list of noise-friendly venues,” said Scott. “We are promoting these quieter establishments to help New Yorkers choose where to dine during Restaurant Week and beyond.”
SoundPrint currently maintains a nationwide database of more than 30,000 noise level submissions, 15,000 of which are in NYC. Additional markets with a growing number of submissions include Boston, Chicago, Denver, Las Vegas, Nashville, New Orleans, Philadelphia, San Francisco and Washington D.C.
F&B Outlook
According to the Mazars 2018 Food & Beverage Industry Study Results Report, released by Mazars USA LLP, most food and beverage companies anticipate a significant increase in sales this year, for the third consecutive year.
2018 was projected to be a very strong year of growth for the Food & Beverage industry, with 90 percent of survey respondents expecting growth in sales, 84 percent in profit and 69 percent in employment. The factors most likely to influence sales growth were new customers, improved sales performance, and new products, which remain virtually unchanged from 2017. The top trends predicted to drive sales growth are private label foods, healthy/nutritious foods and organic foods. The top internal concern for participants was increasing sales, with the top external concerns being rising commodity costs, food safety/traceability, and quality assurance.
“The dynamic nature of the food & beverage industry continues to challenge organizations looking for growth,” said Howard P. Dorman, Partner, who leads the Food & Beverage Practice. “Through this survey, we’re pleased to provide executives with comprehensive insight into potential industry drivers and best practices to stay ahead of the competition.”
The survey delved into performance, planning, and challenges facing food and beverage companies, as well as addressing how they are adapting to changing consumer trends, tax changes, new companies entering the field, and new product and service offerings. Responses were sorted by organization size, providing more nuanced insights. Survey participants included manufacturers, wholesalers/distributors, restaurateurs and retailers/supermarkets representing a range of annual sales volumes from $1 million or less to more than $500 million.
The Mazars 2018 Food & Beverage Industry Study Results Report illuminates the ways that companies remain competitive and approach challenges, providing a valuable resource for all members of the industry.
Brewing Stability
Growth for small and independent craft brewers remained stable for the first half of 2018, according to new mid-year metrics released by the Brewers Association (BA)—the not-for-profit trade association dedicated to small and independent American brewers. Production volume for the craft segment increased five percent during the first half of 2018.
“While more mature, the market continues to show demand for small and independent craft brewers,” said Bart Watson, chief economist, Brewers Association. “There are certainly industry headwinds, but this stabilized growth rate is reflective of the market realities that exist for brewers today.”
As of June 30, there were 6,655 active breweries, up from 5,562 during a comparable timeframe last year. An estimated 2,500 to 3,000 breweries are in planning, based on active Alcohol and Tobacco Tax and Trade Bureau (TTB) licenses.
“The data demonstrate that 2018 is on pace to have the highest number of brewery openings and closings to date. However, even as breweries close, openings continue to far outpace the number that shutter,” added Watson. “New players looking to enter the space should be aware of the constructs of the current landscape, work to differentiate themselves and will need to make quality beer to succeed.”
Transforming F&B
Millennials have had their time in the spotlight; now, companies are looking to the next generation to see how they will impact the future of the food and drink industry. Generation Z*, who are also known as the iGeneration, has the potential to reset expectations for health and wellness, increase the reach of international cuisine and heighten creativity in the kitchen, according to the latest research from Mintel.
Head start on a healthy lifestyle
Regardless of age, sugar is at the top of parents’ watchlists when it comes to what their kids eat and drink. In fact, 60 percent of parents with kids aged 12-17 and 55 percent of parents with kids aged 18+ in the household report saying “no” to their kids’ food and drink choices based on sugar content. But while sugar is a key concern for parents, just 11 percent of US food and drink launches aimed at children (ages 5-12) from June 2017-May 2018 had low, no or reduced sugar claims, according to Mintel Global New Products Database (GNPD).
With parents on the lookout, America’s youngest consumers are increasingly growing health-conscious themselves. In fact, one quarter (25 percent) of teens aged 15-17 say they worry about staying healthy, with another 49 percent agreeing that they think drinking soda is unhealthy.
“Generation Z has come of age at a time when health and wellness is a major consideration. Many younger members of Generation Z follow their parents’ healthy ways and it seems health-consciousness only gets stronger as they approach adulthood. However, health is multi-faceted for this group, suggesting that better-for-you formulations, such as craveable fruits and vegetables, can be expanded to give this generation options that fit with their ever-changing diet priorities,” said Dana Macke, Associate Director, Lifestyles and Leisure Reports, at Mintel.
Gen Z goes international
Today’s younger generations are the most diverse in US history and in addition to their varied racial and ethnic backgrounds, parents are raising their children to have broader palates. Gen Z seems to be cultivating an appreciation for international cuisine from a young age as 36 percent of US parents of children under age 18 agree that their kids enjoy eating international foods.
Interest in international cuisine goes well beyond the more commonplace varieties such as Italian, Mexican and Chinese as Gen Z consumers are driving consumption of more emerging international food and drink. In addition to interest in eating at international restaurants such as Indian (36 percent), Middle Eastern (38 percent) or African (27 percent), adult Gen Z consumers are also much more likely than other generations to find culinary inspiration from social media: 62 percent of young adults aged 18-22 say they cook international cuisines at home from social media, compared to 46 percent of Millennials (aged 23-40) and 23 percent of Generation X consumers (aged 41-52) who cook at home.
“Generation Z is America’s most diverse generation yet. With exposure to international foods starting at an early age, whether in restaurants or at home, Generation Z is more likely to be open to the latest international food trend or innovative fusion creation. These adventurous habits are creating opportunities across categories, presenting potential for products such as tikka masala meal kits or Chinese Peking duck-flavored potato chips. While restaurants remain the most common points of discovery for international cuisine, younger consumers’ exposure to a range of cuisine types creates opportunities for brands to offer more authentic and hybrid flavors,” said Jenny Zegler, Associate Director, Mintel Food & Drink.
Digitally native upbringing leads to DIY mentality
Raised in an era where consumers have access to information at their fingertips 24/7, younger generations have grown up with the ability to thoroughly research their hobbies and interests, resulting in 80 percent of Gen Z consumers under age 18 saying their hobbies/interests are just as important as their school work. What’s more, 36 percent of consumers aged 10-17 and 31 percent of those aged 18-22 believe that being creative is an important factor to being successful as an adult. This highlights an opportunity for food and drink brands to offer do-it-yourself experiences that help tweens, teens and young adults be creative and, eventually, confident in the kitchen.
“The wide range of food media, whether MasterChef Junior or YouTube videos, has piqued an interest in food and drink among some members of Generation Z. This younger generation’s easy access to technology and interest in being creative presents an opening for interactive products that encourage Gen Z to safely experiment and extend their passion for food and drink, such as chips that allow consumers to make their own flavor or kits to make more complex recipes or international meals at home,” concluded Zegler.
Germany’s Vegan Revolution
Over the past few years, Germany has emerged as a leading force in the so-called ‘vegan revolution’. New research from Mintel shows that Germany has retained its crown as the country with the highest percentage of global vegan food and drink launches, accounting for 15 percent of global vegan introductions between July 2017 and June 2018.

Vegan launches more than double
Globally, five percent of all food and drink products launched between July 2017 and June 2018 were vegan, while 11 percent were vegetarian. While the number of vegetarian launches has been relatively stable over the past few years, vegan launches more than doubled in the past five years, growing by 175 percent from July 2013 to June 2018.
In Germany, vegan claims are almost twice as frequent as vegetarian ones: 14 percent of all food and drink launches appearing on the market between July 2017 and June 2018 carried vegan claims, while only 8 percent featured vegetarian claims. Featuring on just 4 percent of food and drink launches five years ago, vegan claims in Germany have grown exponentially between July 2013 to June 2018, more than tripling (240 percent) during this time period.
Katya Witham, Global Food & Drink Analyst at Mintel, commented,
“In recent years, consumers around the world have increased their intake of plant-based foods and Germany is no exception. Our research shows that stricter plant-based diets like veganism are still niche, while a much higher percentage of consumers are embracing ‘flexitarianism’. The majority of consumers are not giving up meat; they are making room for more vegan products as part of ‘flexitarian’ dieting, opening opportunities for plant-based food and drink innovation. Moreover, the rapid growth of vegan products in Germany also reflects the rise of ethical consumerism, especially among younger consumers.”
The spirit of flexitarianism seems to resonate in Germany: 20 percent of 16-24-year-old Germans had purchased meat alternatives in the three months before taking part in Mintel’s survey in 2017, and half of all German consumers (50 percent) believe that plant proteins are just as nutritious as animal proteins. In fact, nearly one in five (17 percent) think that plant protein tastes better than animal protein.
Katya Witham continued,
“The appeal of products without animal-derived ingredients has extended far beyond the limited pool of steadfast vegans and vegetarians, carving a place within overall healthy and varied diets. Food and drink manufacturers would do well to incorporate vegan claims into wider health and ethical-related product positioning, serving the purpose of providing transparency, and communicating product suitability to the widest range of consumers.”
Wine Trends
As the wine industry has been experiencing its fair share of twists and turns in recent years, L.E.K. Consulting has released a list of the 10 biggest trends currently affecting the wine sector.
Topping the list, L.E.K. notes the already huge wine market is still growing steadily. Last year alone, U.S. consumers uncorked $32 billion worth of wine – a number that’s expected to reach $43 billion by 2022, for an annual growth rate over 6 percent. L.E.K. research shows that even an economic downturn would not adversely affect growth, as the trajectory stayed positive during the 2007-08 recession. In addition, “fine and premium” wine (over $10 a bottle) sales have grown around 8 percent a year since 2012 and are on pace to hit around $25 billion by 2022.
Among the other trends facing the wine sector:
Labor shortages are beginning to take a toll. Already a primary concern for the U.S. wine industry, labor shortages have been heightened by recent immigration policy reforms. Further exacerbating the issue is increased competition from alternative crops – newly legalized marijuana crops offer workers better pay and less physically taxing work.
Direct-to-consumer (DTC) sales are on the rise. Shipments to consumers from wineries approached $3.1 billion in 2017 and are expected to grow around 11 percent a year to reach $5.2 billionin 2022. Smaller wineries are leading the DTC trend.
Millennials are driving overall wine market growth. Between 2012 and 2016, millennials and Gen Xers upped their share of consumption by 8 percent – and edged out baby boomers as the biggest consumer segment in the wine market. In fact, millennials’ current affinity for rosé wines saw consumption rise by 53 percent in one year.
“Drinking in” is the new thing. Driven by millennials who are unwilling to pay high restaurant wine markups, off-premises consumption now represents more than 80 percent of overall wine consumption – more than off-premises consumption of beer or distilled spirits.
“One of the top trends we noticed was the continuing consolidation of the wine industry,” says Rob Wilson, Managing Director at L.E.K. and author of “Top 10 Trends Affecting the Wine Industry.” “Last year, the top 14 suppliers controlled about 80 percent of the U.S. wine market by volume. Buying and M&A opportunities remain, however, as some 9,000 suppliers produced the remaining 20 percent.”
Finishing the top 10 trends: New forms of packaging – boxed wine, single-serve, canned wine – are gaining steam as “drinking in” becomes the norm; distributor consolidation is limiting market access for all but the biggest wholesalers; and wine shipping laws are slowly, but surely, evolving, making it easier for smaller wineries without distributors to reach consumers.
50 Best Southern Restaurants
OpenTable unveiled the 50 Best Southern Restaurants in America for 2018. Featuring restaurants across 14 states and Washington D.C., including ten in the South, the list evokes all the joys of summer picnic fare without having to break a sweat.
While Southern states claim the most number of restaurants on the list, with Louisiana in the lead with eight, northern and mid-western states including New York, Philadelphia, and Illinois prove that Southern hospitality can take root anywhere. From Café Dupont’s famed fried chicken in Birmingham, Alabama and Antebellum’s mouth-watering shrimp and grits in Flowery Branch, Georgia to Acadiana’s soft shell crabs in Washington, D.C. and Maple Tree Inn’s Étouffée in Blue Island, Illinois, diners don’t have to venture too far this summer to find the best Southern fare near them.
“OpenTable’s list of the best Southern restaurants offers diners plenty of options to savor flavors that are strongly associated with warm summer days and balmy nights, although the honorees serve standout Southern fare year-round,” said Caroline Potter, OpenTable’s Chief Dining Officer. “While winning restaurants are sprinkled throughout the nation, spots in southern states rightfully dominate the list, which works as a handy guide for travelers who want to eat their way through the region.”
The 50 Best Southern Restaurants in America for 2018 list is generated solely from more than 12 million verified OpenTable diner reviews for more than 27,000 restaurants in all 50 states and Washington, D.C. collected between June 1, 2017 and May 31, 2018. All restaurants in the “Southern” cuisine category with a minimum “overall” score and number of qualifying reviews were included for consideration. Qualifying restaurants were then scored and sorted according to their overall food rating.
Based on this methodology, the following restaurants, listed in alphabetical order, comprise the 50 Best Southern Restaurants in America for 2018 according to OpenTable diners. The complete list may also be viewed at www.opentable.com/lists/best-southern-restaurants-2018.
50 Best Southern Restaurants in America for 2018
Abel Brown – Augusta, Georgia
Acadiana – Washington, D.C.
Acre – Auburn , Alabama
Alligator Soul – Savannah, Georgia
Anson – Charleston, South Carolina
Antebellum – Flowery Branch, Georgia
Atchafalaya Restaurant – New Orleans, Louisiana
The Boil Waverly – New York, New York
Boucherie – New Orleans, Louisiana
Brennan’s of Houston – Houston, Texas
Cafe Dupont – Birmingham, Alabama
Carrollton Market – New Orleans, Louisiana
Circa 1886 – Charleston, South Carolina
Cured – San Antonio, Texas
Cypress Restaurant – Tallahassee, Florida
Distilled at The Sire Hotel – Lexington, Kentucky
Dogwood Southern Table & Bar – Charlotte, North Carolina
Fixe – Austin, Texas
High Street Caffe & Vudu Lounge – West Chester, Pennsylvania
Highball & Harvest – Orlando, Florida
Highlands Bar & Grill – Birmingham, Alabama
Hot and Hot Fish Club – Birmingham, Alabama
Ida Claire – Addison, Texas
Kitchen Notes – Omni Nashville – Nashville, Tennessee
The King’s Kitchen – Charlotte, North Carolina
Langdon’s Restaurant – Mount Pleasant, South Carolina
Madison’s – Highlands, North Carolina
Mandolin – Raleigh, North Carolina
Maple Tree Inn – Blue Island, Illinois
Merrick Inn – Lexington, Kentucky
Midtown Cafe – Nashville, Tennessee
Mozelle’s Fresh Southern Bistro – Winston-Salem, North Carolina
Mr. B’s Bistro – New Orleans, Louisiana
Muriel’s Jackson Square – New Orleans, Louisiana
The Olde Pink House Restaurant – Savannah, Georgia
Preserved Restaurant – St. Augustine, Florida
Rapscallion – Dallas, Texas
Restaurant IRON – Pensacola, Florida
Restaurant R’evolution – New Orleans, Louisiana
Restaurant Rebirth – New Orleans, Louisiana
Root & Bone – New York, New York
RT’s Restaurant – Alexandria, Virginia
Rx Restaurant – Wilmington, North Carolina
South City Kitchen – Multiple locations
State of Grace – Houston, Texas
Stella’s Bistro – Simpsonville – Simpsonville, South Carolina
Toutant – Buffalo, New York
Urban Grub – Nashville, Tennessee
Willa Jean – New Orleans, Louisiana
Yardbird Southern Table & Bar – Multiple locations
Emotionally Connected to Brands
Motista released new data comparing the Emotional Connection rankings of 50 of the top brands in the U.S.
In its report, “Ranking Emotional Connection: A Look at 50 of the Top U.S. Brands,” Motista assessed over 250,000 U.S. consumers and analyzed to what extent they were emotionally connected with these brands. Each brand was given an Emotional Connection Score®, which is a predictive metric that measures the degree to which a consumer connects their values, desires, and/or aspirations to a brand. The higher the score, the greater the percentage of customers that connect emotionally to that brand. Additionally, the Emotional Connection Score® exceeds other measurement methods, like CSAT, NPS, and Brand Health in predicting the financial growth opportunity of a brand.
Here are the top five emotionally connected brands based on this study:
The commonality found amongst the top five is their relentless pursuit to deliver a consistent customer experience, motivating the precise emotions that determine a customer’s behavior. Emotional Connection is the most predictive driving force behind brand purchasing decisions and the long-term loyalty of consumers. Increasing a brand’s emotionally connected consumers by one percent, on average, equates to an increase in revenue upwards of $85 million, dependent upon the brand and industry.
“While retail and ecommerce brands comprise more than half of the brands ranked on this list, many of these companies still need to better target their emotionally connected customers and work to identify prospects with a predisposition for Emotional Connection in order to reach their full potential in revenue growth,” said Michael Mathias, president of Motista. “If brands don’t activate Emotional Connection, they will continue to lose the battle with larger online retailers like Amazon and Walmart.”
Yet, even with solid pricing structures and convenience strategies, Amazon and Walmart still are not achieving a strong showing in Emotional Connection with rankings of 18 percent and 17 percent respectively, which means they are also leaving potential revenue on the table.
Rounding out the bottom five brands ranked in this study, Tylenol, tying Walmart, has an Emotional Connection Score® of 17 percent; Home Depot comes in at 15 percent; Chevron with 12 percent; and Overstock at 10 percent. These findings illustrate how merchandising, convenience, and seemingly minimal cross-channel experience strategies for consumers have been commoditized. These brands are missing the mark on identifying the precise emotions that align with the behaviors that drive the most profitable growth.
Smart and Sustainable Packaging Trends
Packaging is critical for enhancing the functionality of products as well as winning over new consumers. Of late, smart and sustainable packaging trends have gathered pace owing to busy lifestyles and rising per capita disposable income of consumers across the globe. Recent innovations are demonstrating that both the packaging trends can coexist and grow harmoniously, says leading data and analytics company GlobalData.
According to the company’s global consumer survey in Q1 2017, half of consumers globally find the concept of interactive packaging ‘exciting’ or ‘nice to have’, while 8 percent even consider it to be ‘essential’.
Lia Neophytou, Consumer Markets Analyst at GlobalData, says: “Brands have been incorporating new technologies into packaging designs that can improve the user experience by, for example, sharing additional brand information, product information or by connecting with an online social media platform.”
Last year, Frito-Lays owned Tostitos launched a limited-edition ‘Party Safe’ bag with a sensor which could detect how much alcohol a user had consumed. The sensor would turn red and administer an Uber code for consumers who were over the limit to use to get home safely.
However, embedding electronics into everyday packaging has recently raised serious questions about disposal, given the world’s increased commitment toward sustainability. Last year, UK-based PragmatIC Printing addressed this issue with the launch of a range of smart labels without silicon to make it easier for these labels to be recycled.
Neophytou adds: “There are also more simple steps that brands can take to ensure that their smart packaging designs do align with the sustainable packaging trend. For example, communicating closely with recycling bodies during the developing stages can ensure from the outset that smart packaging is fit to be recycled.”
Recycling return schemes and other programs, which reward the consumer for properly disposing of packaging waste, are also other options.
Neophytou concludes: “In future, it is important that brands recognize both trends and ensure that their packaging designs do not isolate consumers, who consider recyclability an important consideration in their purchasing decisions. Doing so will also set a new standard for smart packaging and it will encourage industry players operating in the same or adjacent fields to align their actions in the same way.”
Payment Trends
Global payments technology company First Data analyzed real transactions at 1.3 million merchant locations in the U.S., and is now sharing the latest results on restaurant spending in Q2 2018.
Key Q2 restaurant spending highlights include:
National chains continue to outpace SMBs: For the fifth consecutive quarter, national restaurants (4.3 percent) enjoyed greater YOY growth than SMBs (2.1 percent). This gap has grown considerably since Q2 2017, when chains earned a 4.3 percent YOY growth compared to 3.6 percent for SMBs. However, average ticket prices at SMBs outpaced national chains in every restaurant category in H1 2018.
Restaurants Outpaced Grocery: Restaurants growth reached 3.6 percent YOY in Q2, outpacing grocery growth at 1.7 percent YOY. For both restaurants and grocery, average ticket growth fell to 1.3 percent YOY in Q2, compared to 2.4 percent for restaurants and 1.9 percent for grocery in Q1.
QSR, Fast Casual Driving Restaurant Growth: QSRs enjoyed a 7.0 percent spending growth YOY in H1 2018, compared to 6.4 percent in H2 2017. Fast casual restaurant spending also surged 2.0 percent in H1 2018 compared to just 0.2 percent in H2 2017. Conversely, upscale dining spending declined 0.1 percent in H1 2018 (down from 0.6 percent in H2 2017) while family dining dipped to a 1.5 percent increase from 2.1 percent over the same time periods.
Average Ticket Growth Declines: The average ticket price increased 1.3 percent YOY in Q2 2018, down slightly from the 1.9 percent growth witnessed in Q1. Grocery saw a similar decline in average ticket growth, dropping from 2.4 percent in Q1 to 1.3 percent in Q2.
By way of background, First Data powers nearly half of all credit and debit card transactions in the U.S. and offers insights via its SpendTrend Report—a macro-economic indicator based on aggregate same store sales activity across merchant locations First Data processes transactions for in the U.S.
Confidence in Digital Marketing
Businesses are confident that their digital marketing efforts are successful, according to a new survey from Clutch.
More than 80 percent of digital marketers believe their company’s digital marketing is effective in increasing sales and revenue.
“That number is high because digital marketing is where customers are,” said Flynn Zaiger, CEO of digital marketing agency Online Optimism. “Walking down the street, people aren’t looking at billboards or checking newspapers – they’re staring at their phones.”
The survey reveals that businesses believe their digital marketing is effective because it’s a more direct way to reach consumers compared to traditional marketing and advertising.
Businesses Rely on a Combination of Digital Marketing Channels to Achieve Goals
Businesses invest in a variety of digital marketing channels but prefer social media marketing (81 percent), a website (78 percent), and email marketing (69 percent) because they are the most popular among consumers.
All three channels provide businesses the opportunity to give voice to their brand – especially when used in combination.
“People are responsive when you have the ability to tell your brand story, whether it’s on social media, your website, or email,” said Jeremy Greenberg, founder of web design and digital marketing agency 97 Switch. “With other mediums, there’s not as much ability to tell your story.”
SEO Least Popular Channel, Requires Too Much Effort
The new survey revealed that among businesses surveyed, fewer than half (44 percent) invest in SEO.
Failure to invest in SEO, however, can undermine the effectiveness of a website and other digital marketing channels.
SEO isn’t popular among businesses because it takes more effort than other channels, experts say.
“Businesses have a harder time with SEO,” said Jon Borg-Breen, co-founder and head of sales at B2B lead generation agency Symbiont Group. “It’s not as immediately impactful as having a brand-new design on your website that people can say, ‘Wow, that looks cool.’”
SEO may not have the immediate results that social media marketing, a website, and email marketing have, but experts agree it is still an essential digital marketing channel.
Businesses Use Digital Marketing to Increase Sales and Revenue
Businesses invest in digital marketing to increase their sales and revenue. Nearly one-third (28 percent) identify driving profits as their primary goal.
Many businesses depend on digital marketing to make a sale.
“If we didn’t have digital marketing, the only sales we’d have would be friends and family and word-of-mouth,” said Devin Stagg, marketing manager at Pupford, a website for dog owners. “It’s our main method of exposure, and all our efforts are pushing us toward getting more revenue.”
Clutch’s 2018 Digital Marketing Survey included 501 digital marketers from U.S. companies with more than 100 employees. Read the full report here: https://clutch.co/agencies/digital-marketing/resources/how-businesses-use-digital-marketing-2018
Is a Hot Dog a Sandwich?
Ibotta released findings from its ‘Q Rating’ report. Ibotta found that more than one-third of all Americans do, in fact, consider a hot dog a sandwich. The results are part of a joint survey and study of more than 220 million receipts from Ibotta users since January 2016. Ibotta analyzed consumer shopping behavior around summer BBQ season, looking at purchases typically associated with grilling – hamburgers, hot dogs, buns, grilling supplies and condiments.
Californians are nearly split on their view of a hot dog’s classification, with 49 percent of respondents considering it a sandwich. Across the country, Vermont residents fall on the other end of the spectrum with nearly two-thirds saying a hot dog does not qualify as a sandwich. As to what they’re topping their dogs with, BBQ lovers are pretty evenly split on their preferred condiments, with 26 percent reaching for ketchup and a close 23 percent reaching for mustard. Forty percent of survey respondents double up with both condiments, while only 11 percent choose no toppings at all. And it turns out age plays a role in the great topping debate, with 41 percent of respondents aged 61-70 choosing mustard, while 34 percent of respondents aged 21-30 go with ketchup every time.
“Ibotta is proud to help Americans save money on summer essentials like grilling supplies, hot dogs and hamburgers,” said Bryan Leach, Ibotta founder and CEO. “No matter what you prefer to throw on the grill, we’re here to help you save time and money so you can spend more time enjoying the summer BBQ season and less time shopping for it.”
In addition to the hot dog debate, Ibotta’s analysis found that, since 2016, Missouri led all 50 states in the purchase of grilling supplies like charcoal, matches and lighter fluid based on year round purchasing data. Oklahoma and New Hampshire over-indexed in purchases of hot dogs and ground beef, respectively, during the same time frame.
During peak summer BBQ months of June, July and August in 2015, 2016 and 2017, Vermont residents topped all other states in the increase of BBQ purchases like grilling supplies, hot dogs, beef, buns and condiments. Delaware, North Carolina, Texas and Virginia rounded out the top 5 States for summer BBQs based on the same data. Conversely, Utah, Ohio and North Dakota shoppers finished at the bottom of the ‘Q Rating,’ meaning residents in these states enjoy summer grilling season the least based on fewer BBQ purchases during the summer months over the last three years.
Ibotta’s Q Rating data also revealed that, in addition to outpacing all other states with summer BBQs, Vermont residents finished tops in ice cream purchases to cool off during the heat. And, to the surprise of no one, beer sales over-indexed by more than 15 percent from May through July, coinciding with the rising temperatures and summer BBQ season. Lastly, Lay’s potato chips reigned supreme across the country, outselling all other chip brands in every state except Texas, Maryland and Delaware since June 2016.