
According to a Recent Study/Survey … End-of-March 2017 Edition
32 Min Read By MRM Staff
At Modern Restaurant Management (MRM) magazine, we are research junkies and love to comb though reports to find things we think will be useful to our readership. This end-of-March 2017 edition features information on the impact of restaurants in the changing retail landscape, the popularity of craft beer worldwide, grilled cheese facts, peanut power and the importance of having clean restrooms.
Chain Restaurant Slowdown
Coming off a strong performance in 2015, Technomic’s Top 500 chain restaurants experienced a deceleration in 2016 with cumulative sales growth checking in at 3.6 percent, down from 5.2 percent the prior year. Net unit growth stayed relatively stable at 1.7 percent, compared to 1.9 percent in 2015, pointing to declining customer traffic and weakening same-store-sales as the key reasons for the slowdown.
The Technomic Top 500 Advanced Chain Restaurant Report provides Technomic’s exclusive one-year sales forecast by menu category, an expanded outlook and opportunities section, as well as key themes to help navigate the current industry landscape.
“Today’s foodservice environment continues to create challenges for operators to build market share,” states Darren Tristano, Technomic chief insights officer. “Innovative independent restaurants, emerging regional brands and expansion in the Fast-Casual market have pushed operators to be more nimble, focused and convenient. Big chains continue to see challenges with younger GenZ and Millennial consumer patrons who expect greater social corporate responsibility. Consumers will continue to look for quality and value in their foodservice experiences.”
Full service chains within the Top 500 ranking took the biggest hit in 2016, seeing their total sales growth slow from 4 percent to 1.4 percent while unit growth also fell from 1.1 percent to 0.5 percent. While these declines can mostly be attributed to the lagging performance of the top casual dining chains, there were still bright spots to be found, with sales increases in fine dining chains by 4.9 percent and polished casual chains by 4.3 percent.
Relative to its full service counterpart, limited service fared better in 2016, growing its sales at a cumulative rate of 4.4 percent with unit growth of 1.9 percent. Propelling the segment forward was the continued success of fast casual which saw annual sales growth of 8.1 percent. However, signs of segment maturity are starting to become visible as sales growth for fast casual chains dropped under double digits for the first time in recent history. Quick service chains, who make up over 60 percent of the Top 500’s total sales volume, chipped in sales growth of 3.7 percent, down from 4.6 percent in 2015 while unit growth was unchanged over the past two years at 0.9 percent.
Restaurants Revitalize Retail
The increasing popularity of dining out is revitalizing retail real estate around the globe by creating a true sense of community.
The foodservice industry is expanding at an exponential rate with the amount of space dedicated to food growing from five percent a decade ago to 15 percent today. This trend is expected to increase to 20 percent by 2025, according to a global study “The Successful Integration of Food & Beverage within Retail Real Estate” from the International Council of Shopping Centers (ICSC). The study, unveiled at ICSC’s inaugural Food for Thought Conference today, explores foodservice’s impact on retail real estate and strategies to seamlessly integrate restaurants to complement and enhance offerings with the overall retail real estate experience.
For the first time ever in 2016, U.S. restaurant sales eclipsed grocery store sales, a signal of the growing popularity of foodservice. Europe is tracking in the same direction and Asia was the leader in this trend.
“The increasing popularity of dining out is revitalizing retail real estate around the globe by creating a true sense of community where people can go out to dinner, take in a movie and shop, all in one place,” said Tom McGee, President and CEO of ICSC. “Centers that are strategic and innovative when incorporating foodservices are sure to reap benefits such as increases in foot traffic, dwell time and number of visitors.”
Experience and Technology Changing the Game
The two biggest drivers of change in the industry are technology advancements and the rise of an experience economy, which was fueled by millennials and adopted by all generations:
Serving Up Tech: Previously considered immune to the effects of technology, foodservice has found that technology touches every aspect of the dining experience. From improving operational efficiency, ensuring guest retention or easing the ordering process, technology serves both as an enabler and disruptor to foodservice. Consumers are adopting technology services at fast rates and restaurants need to keep up with the pace and ensure they are offering the most advanced ways to order and deliver food.
Eating Out Over New Sneakers: Today’s younger consumers are making it clear that experiences are far more important than the newest product, and the foodservice industry is one of the greatest recipients of their dollars. Restaurants are also seeing this as a rising trend with all generations, as dining out is considered one of the most popular experiences.
Choosing the Right Menu
The expectations of diners, especially millennials, are high as they seek out sophisticated, unique and high-quality dining concepts. In order to meet the varied demands of consumers, shopping centers should provide a mix of local, national and international offerings.
In the U.S. and many other countries, chain restaurants are seeing challenges in maintaining foot traffic and are focusing on delivering decor and excitement that modern diners expect. Retailers and shopping centers need to be ahead of the latest gourmet trends, to deliver food concepts that encourage consumers to return.
Location Matters
Details matter: especially when it comes to location of foodservice operators, as it is critical to attracting major foot traffic. The study recommends looking at two main factors when determining location strategy, the quantity of the surrounding foodservice and the category of foodservice.
Typically, 20 percent of foodservice space should be dispersed across an entire shopping center and feature food service categories such as “refuel and relax” (i.e., coffee shop) or “impulse” stores (i.e., ice cream or candy). The other 80 percent that should be clustered together and include fast casual, fast food and casual dining stores. Gourmet and finer dining establishments located at entry and exit points can draw in and retain maximum foot traffic.
Avoiding a Restaurant Bubble
This rate of rapid expansion coupled with an increase in money invested and oversaturation in the market creates the perfect environment for a restaurant bubble. The potential rising costs of operations and minimum wage in the U.S. further exacerbate the situation.
“To be successful, businesses must support smart expansion and understand how demographic behavior and regional preferences impact which foodservice providers they choose,” said McGee. “The future for foodservice is bright, and with the right approach, a shopping center can build the type of experience that consumers desire.”
Fishbowl’s Emerging Brands
Fishbowl released its annual “Emerging Brands” report, identifying brands best positioned to succeed in the year ahead, as identified through social media analytics. Historically, this report has identified emerging brands in the restaurant industry that have broken through and delivered on the strong promise of growth while embracing progressive developments that are innovative and unique. Consumers are usually eager to ‘discover’ these concepts, becoming emotionally invested in the brands’ growth. This, in turn, creates a sense of ownership that can drive loyalty allowing concepts to develop more quickly, and experience significant growth and success in a shorter-than-average time frame. Concepts like Mendocino Farms, Tender Greens and Shake Shack, are all restaurant chains that have experienced this effect as recognized emerging brands.![]()
This year’s report is no exception. It is an impressive list of newcomers as well as some repeats from 2016 which are continuing to innovate and push ahead in what many are saying is an increasingly tough market. The Top Ten Emerging Brands for 2017 are: Sweetgreen (up to #1 from #3 last year), VERTS Mediterranean Grill, Xian Famous Foods, &Pizza, Asian Box, Cava Grill & Cava Mezze, Dinosaur Bar-B-Que, Founding Farmers, Sushirrito and Epic Burger. While each brand is unique, they share important commonalities—in addition to producing best-in-class food that is generating excitement on the merits of quality and taste, they also exemplify clear missions that resonate with their customers.
“Mission-driven restaurants, that focus on delivering against their promise through the table stakes of quality, good-tasting food, and delighting customers with exceptional service, can break through clutter and win in a very crowded and noisy marketplace,” says Mike Lukianoff, Fishbowl’s Chief Analytics Officer.
Fishbowl’s Social Media Analytics is one key component in the suite of analytical capabilities that Fishbowl delivers to the restaurant and retail industry. Providing clients with deep insights about their customers’ experiences, preferences, buying behaviors, recommendations on menu management and item pricing, and detailed information about the competitive landscape, Fishbowl offers comprehensive analytics suite solutions that change the way data is perceived and leveraged.
“Fishbowl is committed to re-mastering the marketing mission for every restaurant and brick-&-mortar business with a truly integrated intelligence and marketing execution solution,” says Dev Ganesan, CEO of Fishbowl. “Our deep domain experience, coupled with our Customer Engagement Platform, an insight-to-action solution, is propelling strong demand in the restaurant industry as more restaurants adopt technology to differentiate and drive business success. We have long been the trusted partner of the restaurant industry by driving deeper relationships and better results. It’s exciting to see the innovation and growth through the Fishbowl Emerging Brands report and we hope their success continues.”
Best Customer Experience List
Chick-fil-A, Chipotle Mexican Grill, and Hardees deliver the best customer experience in the fast food industry, according to the 2017 Temkin Experience Ratings, an annual customer experience ranking of companies based on a survey of 10,000 U.S. consumers.
Chick-fil-A took the top spot out of the 24 fast food restaurants included in this year’s ratings, earning a score of 83 percent and coming in 2nd place overall out of 331 companies across 20 industries. Chipotle and Hardees tied for second place, each with a rating of 82 percent and an overall rank of 4th.
The ratings of all fast food restaurants in the 2017 Temkin Experience Ratingsare as follows:
- Chick-fil-A: 83 percent
- Chipotle Mexican Grill: 82 percent
- Hardees: 82 percent
- Subway: 81 percent
- Arby’s: 80 percent
- KFC: 80 percent
- Baskin Robbins: 79 percent
- Dairy Queen: 79 percent
- Starbucks: 79 percent
- Dunkin’ Donuts: 78 percent
- Papa John’s: 78 percent
- IHOP: 77 percent
- Little Caesar’s: 77 percent
- Panera Bread: 77 percent
- Popeye’s Louisiana Kitchen: 75 percent
- Sonic Drive-In: 75 percent
- Burger King: 74 percent
- Panda Express: 74 percent
- Wendy’s: 74 percent
- Pizza Hut: 73 percent
- Domino’s: 72 percent
- Jack in the Box: 72 percent
- McDonald’s: 71 percent
- Taco Bell: 71 percent
“It’s impressive that every single fast food company we looked at delivers a customer experience that’s either “good” or “excellent,” states Bruce Temkin, managing partner of Temkin Group.
Overall, the fast food industry averaged a 76 percent rating in the 2017 Temkin Experience Ratings and came in 2nd place out of 20 industries. The average rating of the industry improved by five percentage-points between 2016 and 2017, going from 71.1 percent to 76.5 percent.
The ratings for all fast food restaurants increased between 2016 and 2017, except for Taco Bell, whose score decreased by two percentage-points. Baskin Robbins and KFC improved the most, each gaining 12 points in the last year. To generate these ratings, Temkin Group asked 10,000 U.S. consumers to evaluate their recent experiences with a company across three dimensions:success (can you do what you want to do?), effort (how easy is it to work with the company?), and emotion (how do you feel about the interactions?). Temkin Group then averaged these three scores to produce each company’s Temkin Experience Rating.
In these ratings, a score of 70 percent or above is considered “good,” and a score of 80 percent or above is considered “excellent,” while a score below 60 percent is considered “poor.”
Germany Loves Vegan Products
While vegan is a hot market worldwide, it seems that Germany is the leading country for vegan product innovation globally. According to Mintel’s Global New Products Database (GNPD), Germany was the leading market for vegan food and drink product launch activity in 2016, with 18 percent of all global food and drink product launches with vegan claims occurring in Germany. The only country coming close to this amount of vegan launch activity in 2016 was the United States, where 17 percent of all new global vegan food and drink products were launched, followed by the UK with 10 percent global share.
Mintel research reveals that vegan-friendly launches have soared over the past few years in Germany, with the share of food and drink products featuring vegan claims in total food and drink launches rising from 1 percent in 2012 to 13 percent of all launches in 2016. This is in stark contrast to the fact that, globally, food and drink products with vegan claims only accounted for 4 percent of new food and drink introductions in 2016.
Vegetarian claims have also witnessed growth in recent years in Germany. Over the past five years, the share of food and drink launches with vegetarian claims in total food and drink product launches in Germany more than doubled, rising from 3 percent in 2012 to seven percent in 2016. The global share of food and drink product launches with vegetarian claims is, meanwhile, relatively stable at around 11 percent of all food and drink launches in 2016, with little fluctuation over the last five years.
Mintel research reveals that vegan-friendly launches have soared over the past few years in Germany, with the share of food and drink products featuring vegan claims in total food and drink launches rising from 1 percent in 2012 to 13 percent of all launches in 2016. This is in stark contrast to the fact that, globally, food and drink products with vegan claims only accounted for 4 percent of new food and drink introductions in 2016.
Vegetarian claims have also witnessed growth in recent years in Germany. Over the past five years, the share of food and drink launches with vegetarian claims in total food and drink product launches in Germany more than doubled, rising from three percent in 2012 to 7 percent in 2016. The global share of food and drink product launches with vegetarian claims is, meanwhile, relatively stable at around 11 percent of all food and drink launches in 2016, with little fluctuation over the last five years.
Katya Witham, Senior Food and Drink Analyst at Mintel, said, “Veganism is now seen as a trendy lifestyle, and Germany is home to the most vegan product launch innovation. Today, vegan products attract attention from a much wider audience, namely health and ethically driven, flexi-vegan consumers.”
Currently there is a strong following for meat-free diets in Germany with as many as 7 percent of German adults considering themselves to be vegetarian, while 5 percent claiming to be vegan, however it seems that younger generations in particular are embracing the lifestyles. Mintel research shows that 14 percent of 16-24 year old Germans identify themselves as vegetarian and one in ten (10 percent) are vegan.
In comparison in France 13 percent of 16-24-year-olds identify themselves as vegetarian, followed by 11 percent in Italy, Spain (8 percent) and Poland (11 percent). The picture is similar for vegan consumers aged 16-24, with 12 percent of this age group in France following this diet, followed 9 percent in Italy, Spain (7 percent) and Poland (10 percent).
However, while the levels of vegan and vegetarian product launch activity continues to rise in Germany, research from Mintel GNPD shows that the number of meat-substitute products launched in Germany fell by 17 percent between 2015 and 2016.
“The image of vegans has undergone a significant shift in recent years. The decline in meat substitute product launches could be a sign that the current offering does not fulfill consumer expectations. The trend towards naturalness plays a dominant role in the food choices of German consumers, who prioritise health benefits of unprocessed, natural and wholesome products. Germans are also very distrustful towards the content of the food and drink products they buy, opting for natural products with short ingredient lists,” she added.
Mintel research confirms this, revealing that one in three (33 percent) of German adults regularly check the ingredients list, while 35 percent avoid food and drink products with artificial additives and preservatives. And it seems that the majority of meat substitute products do contain some sort of food additives: according to Mintel, over two thirds of German launches in 2016 in the meat substitute segment contained stabilisers (74 percent), thickeners (72 percent) and bulking agents (63 percent); while over half included emulsifiers (63 percent) and gelling agents (52 percent).
“German consumers are increasingly sceptical about the ingredients in meat substitutes, creating the need for natural formulations with shorter ingredient lists. With long ingredient lists and food additives becoming a topic of growing concern and a possible threat to future sales growth, meat substitute brands should begin to embark on reformulation work in order to make their products more natural. We’re seeing a number of innovators in this area already offering simplified ingredient lists and using naturally sourced ingredients to formulate meat alternative products, leveraging the goodness of vegetables in their recipes.” Witham concluded
Restroom Cleanliness Matters
A new survey shows how businesses ultimately pay a price for having unpleasant restroom conditions – and reap the rewards of providing good ones.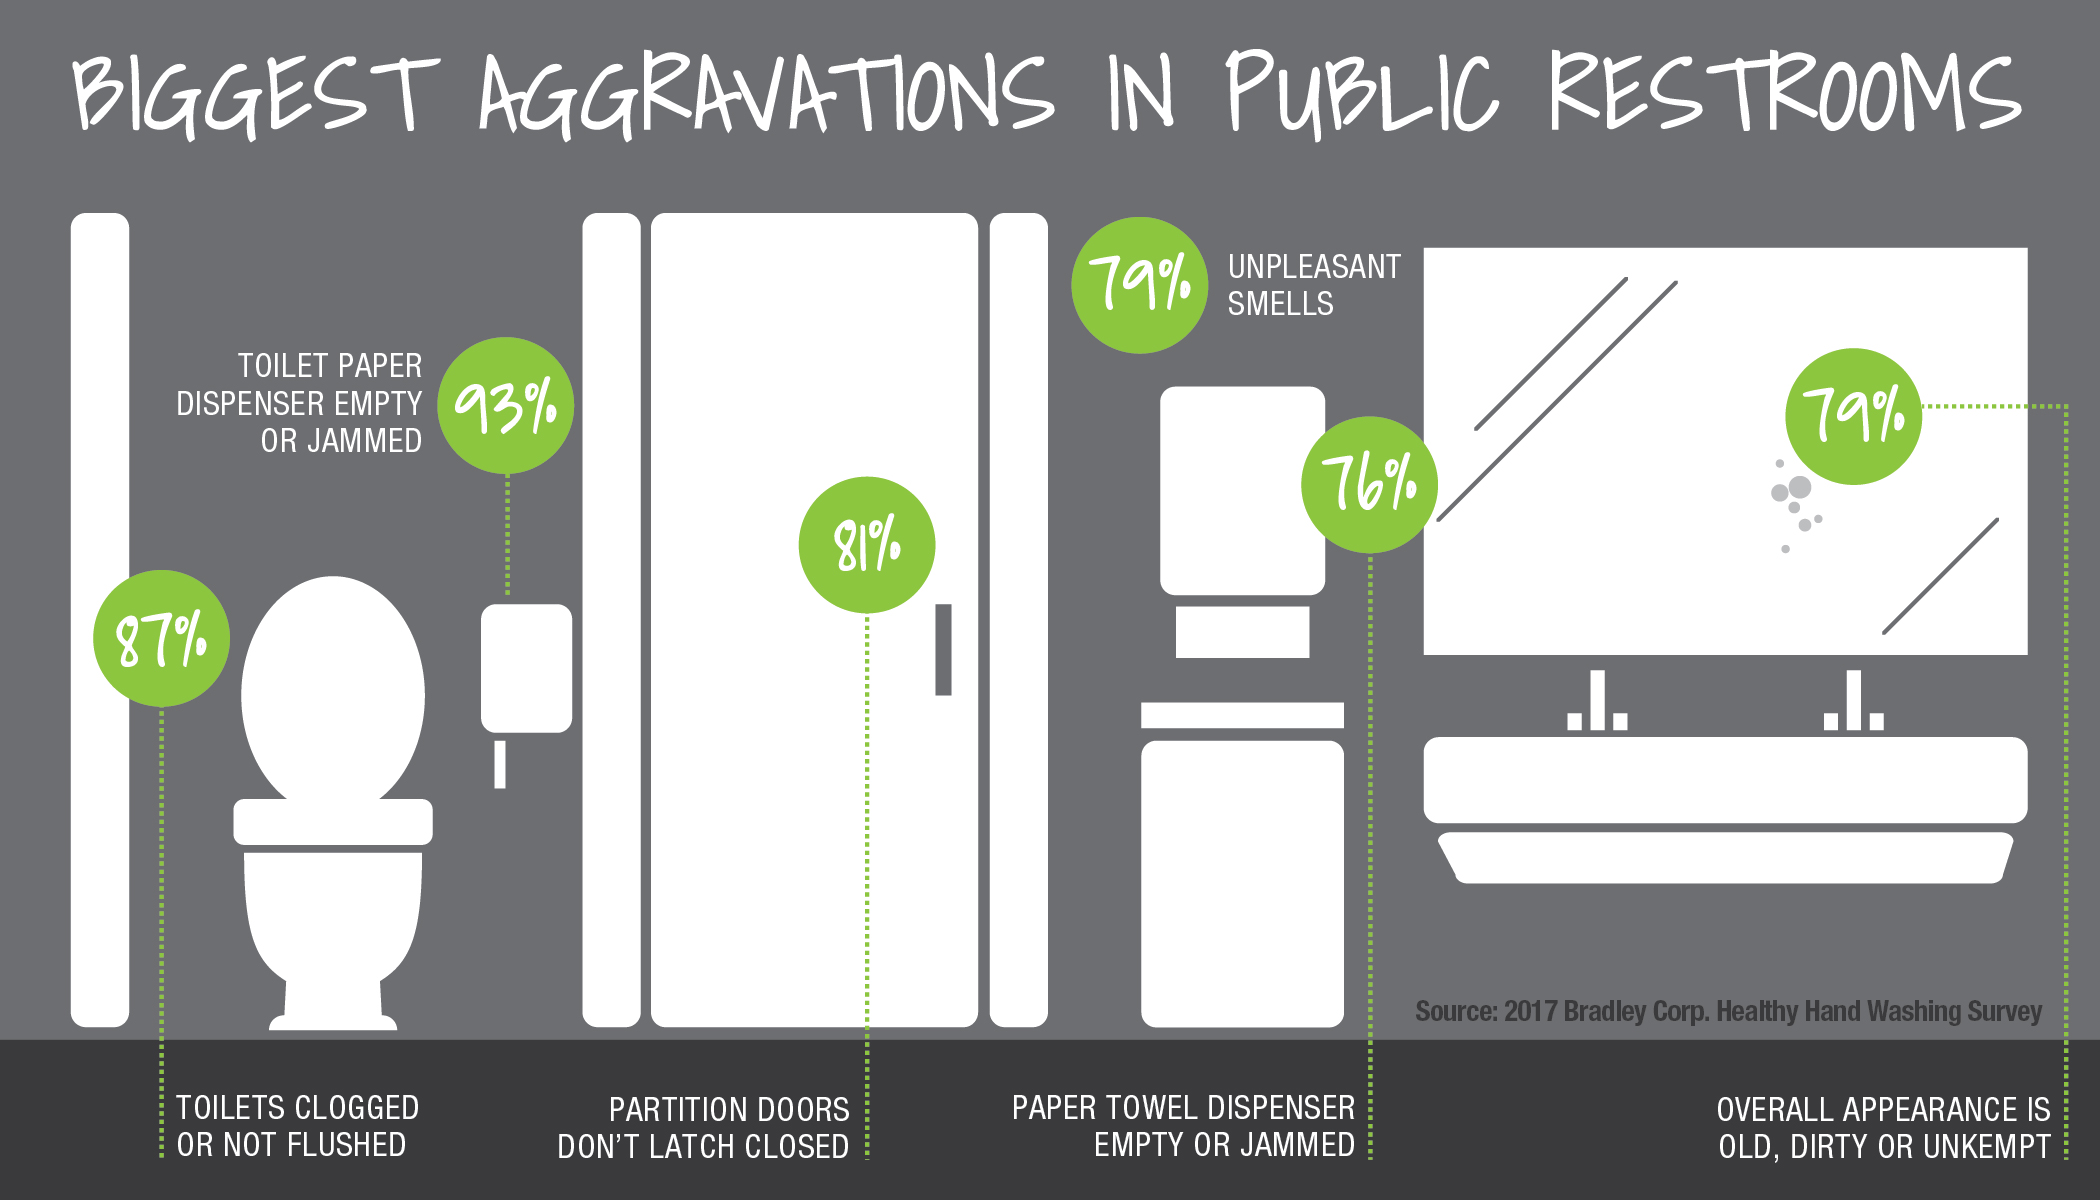
56 percent of American adults said they are unlikely to return to a business after experiencing unpleasant restrooms, according to the Healthy Hand Washing Survey by Bradley Corp. Other disheartened customers will complain to management, tell a friend, post a comment on social media or leave right away without completing their business.
Conversely, businesses that have pleasant, well-maintained restrooms can turn into customer magnets. 70 percent of Americans say they have made a conscious effort to select a specific business because it has restrooms that are cleaner and better maintained. That number is even higher for Millennials – 77 percent of respondents aged 18-34 say they’ve patronized certain businesses because they have cleaner restrooms.
“Depending on their condition, public restrooms can become significant business liabilities – or ringing endorsements,” said Jon Dommisse, director of global marketing and strategic development at Bradley Corp., a manufacturer of commercial washroom products. “Good restrooms clearly give businesses a competitive edge.
“For eight years our survey has shown how letting restroom maintenance slip through the cracks can have a substantial negative impact – ultimately lost business. Now, in contrast, we see that decent restrooms invite positive customer reinforcement and likely attract more sales.”
Moreover, expectations for a business’ restrooms are clearly tied to customers’ perceptions of the quality of the goods or services. According to the survey, 92 percent expect that a business that provides high quality products or services would also have restrooms that deliver a high quality experience.
Despite the high value that customers put on restroom conditions, the survey also uncovered an adverse trend showing that more businesses are at an increased risk for losing customers due to messy facilities. In 2017 almost 70 percent of Americans said they recall having an unpleasant restroom experience – that number was only 60 percent in 2015.
Dommisse said that keeping regular scheduled maintenance on the radar is essential, citing the following common restroom aggravations uncovered by the survey: empty or jammed toilet paper dispensers (mentioned by 93 percent of respondents); clogged or unflushed toilets (87 percent); stall doors that don’t latch (81 percent); bad smells (79 percent); and an overall appearance that’s old, dirty or unkempt (79 percent).
Further, Americans don’t like touching things in public restrooms and they use all sorts of techniques to avoid coming into contact with surfaces like relying on their foot to operate the toilet flusher, using a paper towel to grasp the door handle and hovering over the toilet seat.
When asked what restroom improvements they’d like to see, it’s not surprising that cleanliness topped the list. After that, Americans want touchless fixtures and better stocking of supplies, such as toilet paper, soap and paper towels.
The annual survey queried 1,042 American adults online Dec. 12-15, 2016 about their hand washing habits in public restrooms and concerns about germs, colds and the flu. Participants were from around the country, were 18 years and older, and were fairly evenly split between men and women (49 and 51 percent).
F&B Economic Impact
The Committee for Economic Development of The Conference Board (CED) released a report detailing the U.S. food and beverage industry’s economic impact on the nation’s economy. The non-partisan, business-led public policy organization presented the findings at a forum comprised of industry leaders at the National Press Club.
The report is part of a series of research studies designed to measure the impact that certain industries have on the U.S. economy. Last year, CED released Child Care in State Economies, which examined the economic effects of the child care industry in states throughout the U.S.
The Economic Contribution of The Food and Beverage Industry examines, specifically, how the industry contributes to growth and innovation; the industry’s impact on regional economies; how it responds to emerging and dynamic consumer demand; and, the role of public policy in shaping the market environment for the industry.
Select findings from the CED report are as follows:
Employment
The industry employs 1.46 million workers in nearly 27,000 establishments, accounting for 13 percent of total U.S. manufacturing employment.
It makes an especially robust contribution to lower-population states, accounting for more than 20 percent of all manufacturing employment inNebraska, Idaho, Iowa, South Dakota, Delaware, and Hawaii.
Manufacturing and trade activity
Food (including beverages) is the only major product category in which the United States maintains a positive trade balance with other countries, reflecting our nation’s strong comparative advantage.
While other divisions of the manufacturing sector have waned, the food and beverage industry has remained far more stable due to the steady demand for food and the industry’s continuous innovation.
The industry alone generates a $164 billion in value added. The value added paid out includes $83 billion in total salary and benefits, $9.7 billion in taxes, and $62 billion in property income.
Economic multiplier
Every dollar of the industry’s output generates between $0.40 and $1.35of additional economic activity in local economies.
Additionally, every dollar of the industry’s output generates $1.27 of economic activity in the U.S. economy with expanded international sales.
Product innovation and affordability
At least 40 percent of the industry’s new foods and beverages have positive nutrition or health attributes, in response to consumer demand for healthful products.
The industry spends $5.4 billion annually on research. Venture capital firms invest another $3 billion to fund innovations in food market and processing technologies.
The industry contributes to food affordability. U.S. consumers spend less than 10 percent percent of income on food, and less than consumers in other comparable countries.
Farm sector
The industry transforms raw farm commodities from more than 2 million farms into consumer food and beverage products; they are marketed through nearly 700,000 retail stores and foodservice outlets.
The industry provides the link between farms and retailers to meet the needs of 320 million U.S. consumers.
“The industry is an important contributor to GDP growth and jobs at both the national as well as at the regional and local levels,” said Mike Petro, Executive Vice President of CED.
“With 87 American factories employing more than 51,000 people, we’re proud to be part of an industry making such a positive economic contribution to the U.S. economy. Nestlé is also working to address the skills gap in the industry through Project Opportunity, a career-acceleration program designed to help people of all ages gain work experience and training in food and beverage manufacturing.”
Spot HD Addition Increases Sales
Adding Spot HD printing technology to conventional signage printing techniques has a measurable impact on increasing sales of premium and ancillary items according to an exclusive study commissioned by Windsor Marketing Group (WMG) and conducted by the research team from Bentley University’s Center for Marketing Technology.
WMG, a leading producer of in-store marketing solutions for many of the world’s premier retailers, asked Bentley researchers to measure the impact of emerging HD merchandising production technology on consumers in order to better understand how different types of in-store marketing printing techniques affect what a viewer sees and what the viewer recalls. The study was specifically designed to focus on ability of next-generation digital printing to make a visual more attractive and memorable to viewers, creating sensory and appetite appeal.
A series of experiments were devised in the Bentley University Center for Marketing Technology in which a sample group of consumers were fitted with special glasses designed to measure the movement of the eyes. Participants were then shown visuals using High Definition (HD) and Conventional print techniques, and another used Spot High Definition produced from WMG’s cutting-edge G-traxTM system.
The study produced four key findings regarding the impact of Spot High Definition compared with Conventional HD and Conventional Printing:
- Finding 1 (Focus Speed): On average, Spot HD printing attracted eyes to the target focal area 8.2 percent faster than conventional methods.
- Finding 2 (Focus Duration): On average, eyes remained focused on the area using Spot HD printing 15.3 percent longer.
- Finding 3 (Upsell Purchase Intent): Purchase intent for a higher-priced or premium version of an item highlighted by Spot HD printing increased 28.7 percent over traditional HD and 59.7 percent over Conventional printing.
- Finding 4 (Ancillary Item Purchase Intent): On average, consumers are 8 percent more likely to purchase an ancillary item such as a bottle of wine that was merchandised with a primary item such as a pizza or steak when the ancillary item was printed in Spot HD vs. conventional techniques.
“The implication of this research for retailers is critical as they continue to search for ways to drive incremental sales in an increasingly competitive environment,” said Windsor Marketing Group CEO Kevin Armata. “The research clearly shows, especially when all findings are considered together, that advanced printing technology such as Spot HD can have a measurable positive impact on grabbing a customer’s attention and influencing purchase intent and impulse buys.”
WMG invested in the study and has used the results to develop an in-store marketing effectiveness execution model, the Hierarchy of Signage. The Hierarchy of Signage give WMG a process through which they can evaluate their customers’ marketing objectives against available solutions based on sound, measurable insight, and match the solution that best accomplishes them.
“This is not theory,” Armata said. “This is a practical tool that a store manager can use to impact the speed at which in-store marketing is noticed as well as the length of time that a customer stays focused on it. This then translates into favorable purchase intent and when used to promote premium or add-on items, can build the basket-size and impulse buys.”
Craft Brewing Grows
The Brewers Association (BA)—the trade association representing small and independent1 American craft brewers—today released 2016 data on U.S. craft brewing growth. With over 5,300 breweries operating during the year, small and independent craft brewers represent 12.3 percent market share by volume of the overall beer industry.
In 2016, craft brewers produced 24.6 million barrels, and saw a six percent rise in volume3 on a comparable base and a 10 percent increase in retail dollar value. Retail dollar value was estimated at $23.5 billion, representing 21.9 percent market share. By adding 1.4 million barrels, craft brewer growth outpaced the 1.2 million barrels lost from the craft segment, based on purchases by large brewing companies. Microbreweries and brewpubs delivered 90 percent of the craft brewer growth.
“Small and independent brewers are operating in a new brewing reality still filled with opportunity, but within a much more competitive landscape,” said Bart Watson, chief economist, Brewers Association. “As the overall beer market remains static and the large global brewers lose volume, their strategy has been to focus on acquiring craft brewers. This has been a catalyst for slower growth for small and independent brewers and endangered consumer access to certain brands. Small and independent brewers were able to fill in the barrels lost to acquisitions and show steady growth but at a rate more reflective of today’s industry dynamics. The average brewer is getting smaller and growth is more diffuse within the craft category, with producers at the tail helping to drive growth for the overall segment.”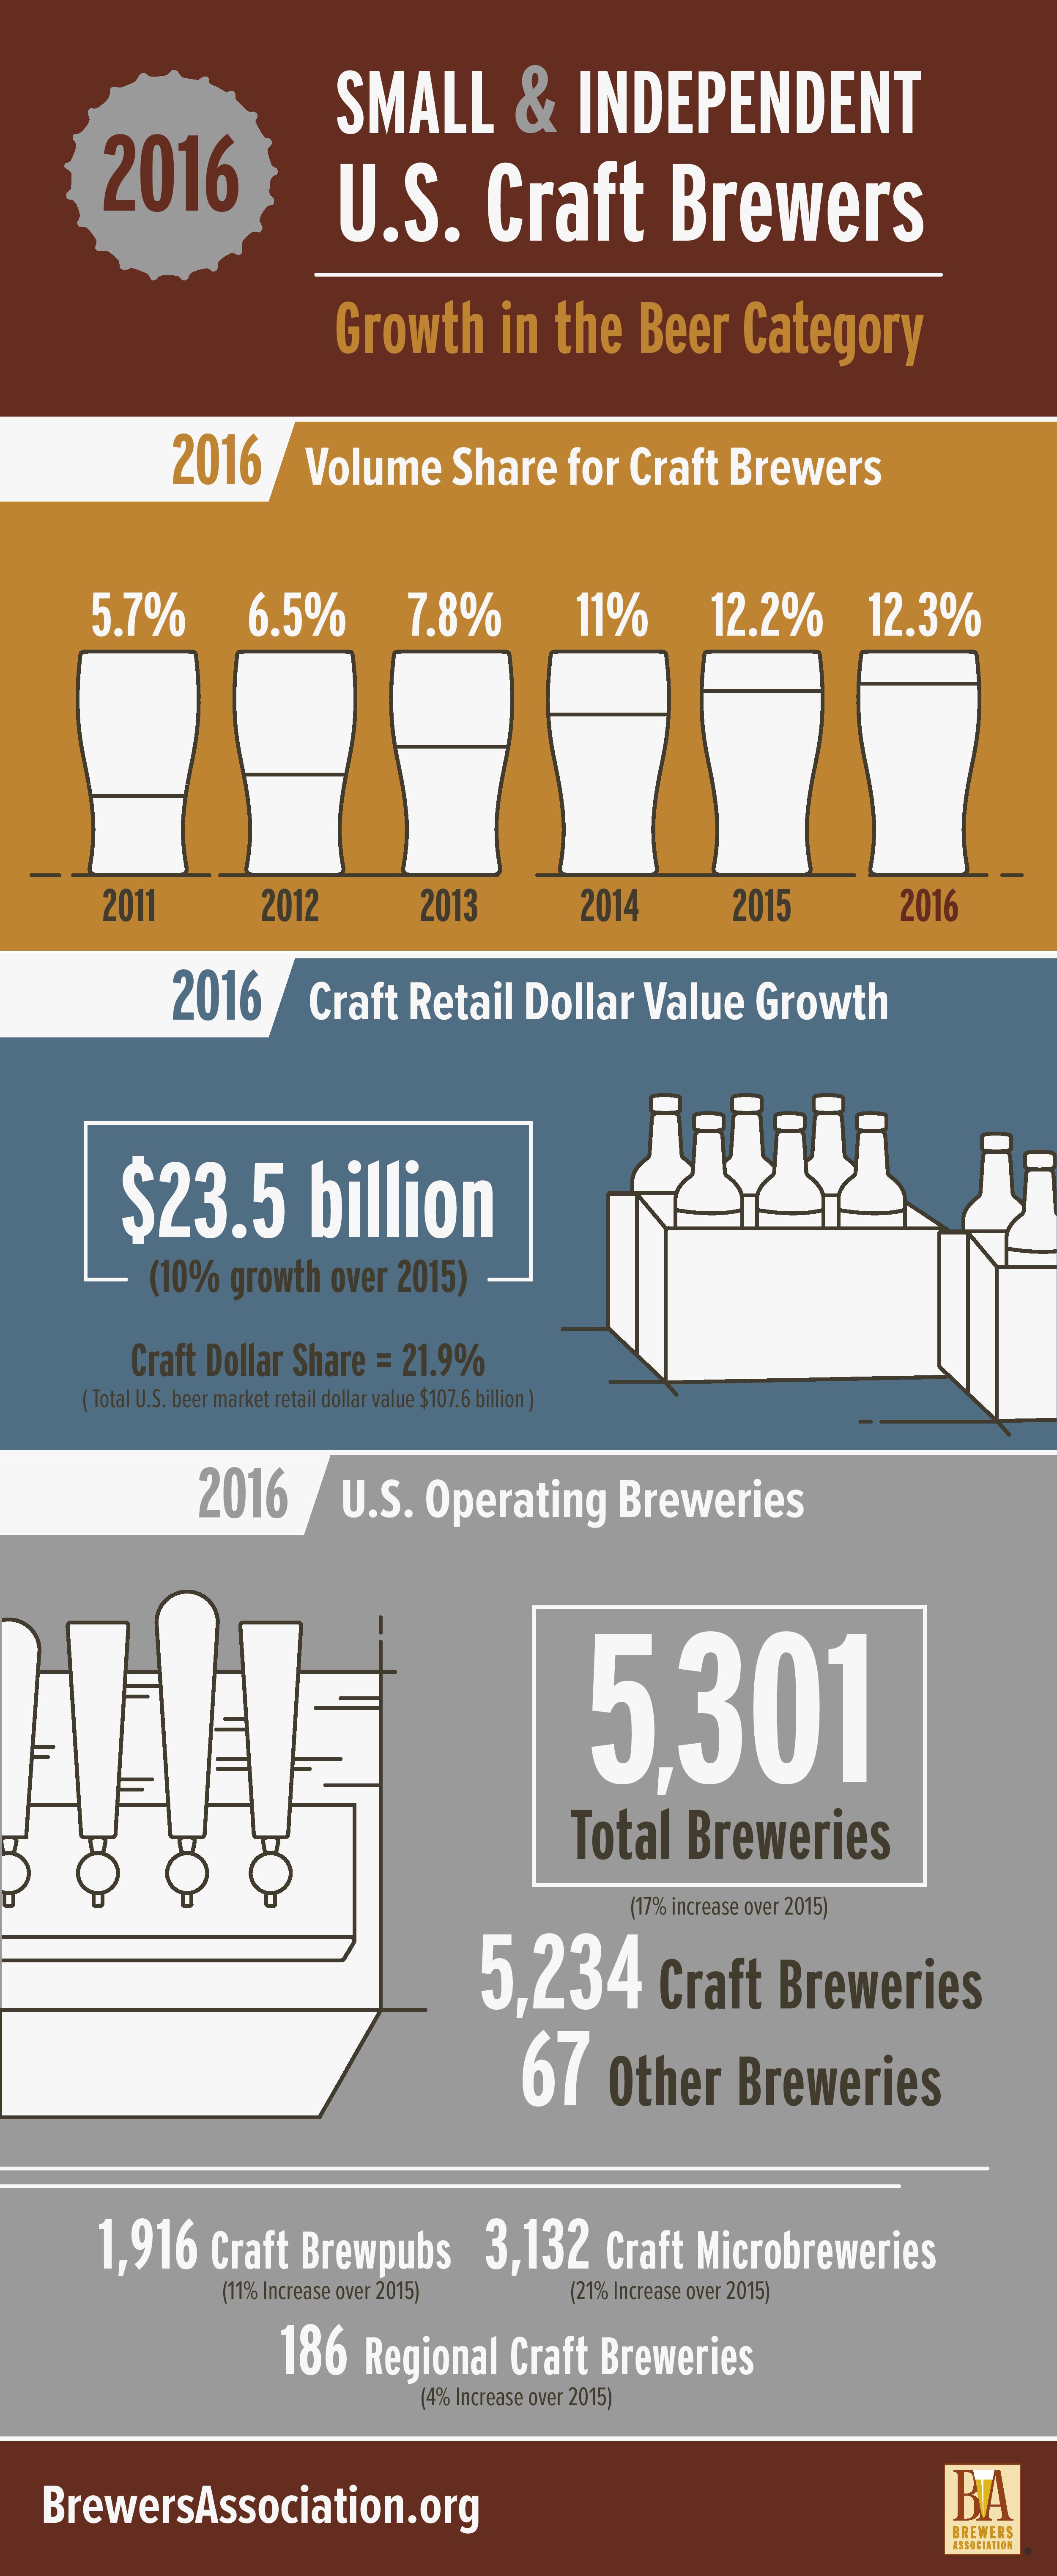
Additionally, in 2016 the number of operating breweries in the U.S. grew 16.6 percent, totaling 5,301 breweries, broken down as follows: 3,132 microbreweries, 1,916 brewpubs, 186 regional craft breweries and 67 large or otherwise non-craft brewers. Small and independent breweries account for 99 percent of the breweries in operation. Throughout the year, there were 826 new brewery openings and only 97 closings. Combined with already existing and established breweries and brewpubs, craft brewers provided nearly 129,000 jobs, an increase of almost 7,000 from the previous year.
Global Craft Beer Market to Grow
The global craft beer market is expected to reach $502.9 billion by 2025, according to a new report by Grand View Research, Inc. The market is expected to witness substantial growth over the forecast period on account of the rising demand for low alcohol by volume (ABV) and flavored beer.
The government in countries including Australia, New Zealand, Belgium,Mexico, China, and the UK are promoting the production of craft beer and incorporation of new breweries on account of the positive contribution of the industry towards economic development and employment generation coupled with the willingness of the consumer to pay extra for better tasting brews.
Australia, Belgium, Germany, U.S. and New Zealand are the major craft beer producing countries with over 65 percent of the overall production in terms of value as well as volume. Belgian is the most preferred beer among the major craft beer consuming countries owing to the premium quality, clean taste and rich flavor & aroma of the brews.
Furthermore, the number of brewers in the global market is growing significantly on account of the rising demand for the product. As a result, the demand for grains such as barley, wheat, yeast, sugar, and hops is increasing substantially. However, the alternative applications of the raw materials are expected to lower the bargaining power of the brewers.
The demand for the pale ale, IPA, and amber ale is growing as these three craft products are widely preferred by the consumers owing to the balanced composition of the raw materials in the product including malt, hops, water, and yeast.
Further key findings from the report suggest:
On-trade distribution of craft beer accounted for over 50 percent in 2015 of the overall volume share, which is primarily attributed to the high consumption of the product in restaurants, bars, and clubs in developed economies including UK, Australia, and Belgium.
Off-trade distribution of the product is expected to witness significant growth in developing economies as the consumer spending power in these countries is low with high price of the product in on-trade distribution outlets as compared to its counterpart
Europe is expected to account for the largest market share in terms of volume owing to the high consumer preference for flavored beer over other alcoholic spirits. In addition, increasing demand for IPA and pale ale in the region is expected to have a positive impact on the market growth.
Middle East & Africa is expected to grow at a CAGR of 28.9 percent owing to the increasing penetration in South Africa. The growing consumer awareness about the wide range of flavors and styles of the product is expected to be a crucial factor for market growth in the country.
Key players in the industry include The Boston Beer Company, The Gambrinus Company, D.G. Yuengling and Son, Stone & Wood Brewing Co. and Chimay Beers and Cheeses. These major players compete on the basis of acquiring new markets and increasing their product portfolio.
Coffee Market Poised for Growth
The Coffee Production market is worth a whopping $13 billion in the U.S., representing a significant and robust industry that’s poised for further growth, according to IBISWorld. The industry purchases coffee beans and processes them into different products that are consumed by a market that mostly consists of adults aged 25 and up.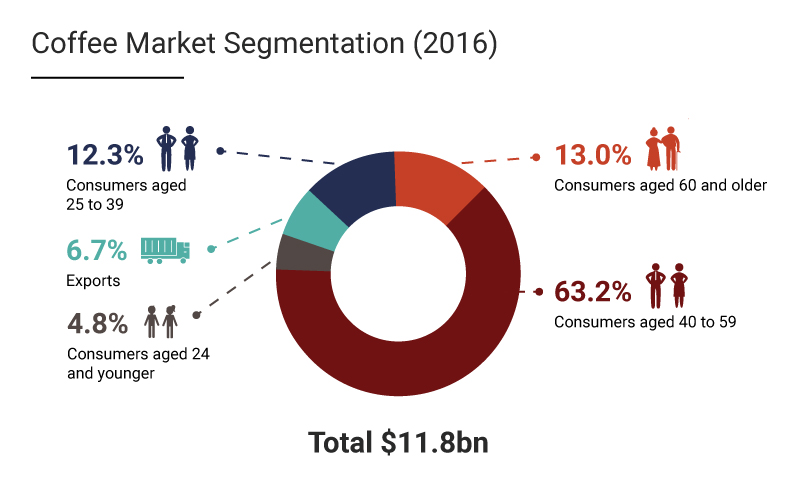
Growing demand from consumers for premium-coffee products has driven much of the growth of the industry, in line with increased per-capita disposable income at an annualised rate of 1.8 percent over the next five years to 2022.
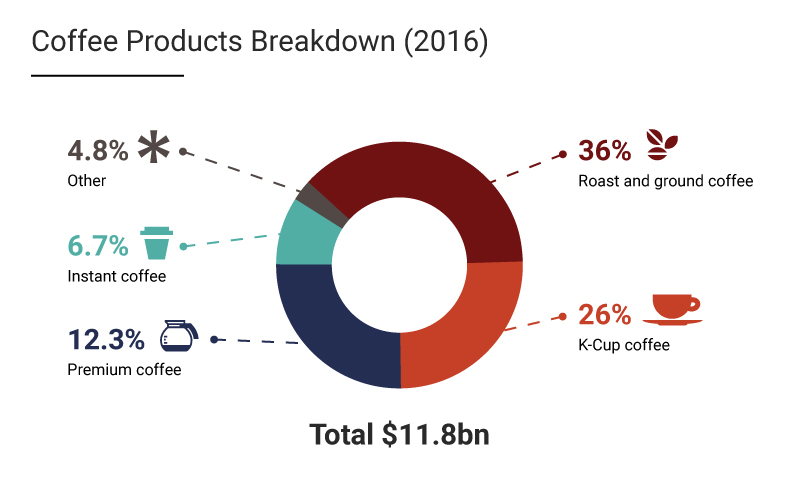
The data visualisations above illustrate the breakdown of the types of consumers, as well as coffee products, outlining who the major consumers of coffee are, and what products dominate the market.
Americans between the aged of 40 – 59 are by far the largest consumers, with a disproportionate 63.2 percent of the market.
When it comes to coffee products, roast and ground coffee command the largest share of the market, followed by single-use serve K-Cup coffee.
Cheesy Facts
Grilled cheese is an American staple with a cult-like following of loyal fans. It is often considered a classic meal, but for many Americans, it’s an opportunity to experiment and get creative with food, but just how creative? A recent national survey conducted in honor of April’s National Grilled Cheese Month by Sara Lee®, revealed nationwide preferences when it comes to the beloved cheesy sandwich. The data uncovered that there are not only two sides to a grilled cheese sandwich (literally) but also two sides to grilled cheese enthusiasts — those who prefer the cheesy sandwich in its simplest form (only bread and cheese) and those who are willing to get creative with their ingredients.
For many Americans, dubbed the “Traditionalists,” the sandwich is best left as is with a classic cheese variety between two slices of timeless white bread. For others, in more of the “Adventurists” camp, there is no limit to grilled cheese ingredient experimentation. In fact, the survey uncovered that those with blonde hair are most likely to try new ingredients in their sandwiches — 82 percent of blonde Americans surveyed said they’d prefer more than just cheese on their grilled cheese sandwiches, compared to only 67 percent of brunettes.
“No matter which side you fall on, an overwhelming 89 percent of respondents agreed that the great thing about grilled cheese is that it can always be a little different, meaning consumers can customize their sandwiches in a way that’s unique to their individual tastes,” said Ben Buch, Brand Manager for Sara Lee bread. “Artesano bread serves as the perfect canvas to whatever grilled cheese creation you’re craving this National Grilled Cheese Month, whether it has surprising ingredients or just a classic take with cheese.”
The Traditionalists
Fifty-five percent of those surveyed can be classified as grilled cheese Traditionalists, meaning there’s only one kind of cheese for them, with the survey finding the two most popular cheese options are American or cheddar. More than a quarter of Americans feel a grilled cheese should be kept to just the main ingredients — bread and cheese, and nothing more — but if these purists had to choose additional fillings, they would most likely include tomato (39 percent), bacon (38 percent), ham/pork (32 percent), or eggs (22 percent).
So, who are these grilled cheese Traditionalists? The survey unveiled that they’re most likely brunettes, in their 30s, or over the age of 55. For instance, those 55+ were more likely to say they would never try the following inside their grilled cheese sandwich: pickles (50 percent), avocado (49 percent), onions (43 percent), or turkey (30 percent).
The Adventurists
The grilled cheese Adventurists are the ones who are up for a thrill-seeking sandwich experience. In fact, the survey uncovered that almost two-thirds of Americans would eat a “mystery” grilled cheese without having a clue what’s inside or even what type of cheese is included, and it’s more likely that these Adventurists are blondes. Those with a child in the household are also more likely to try a mystery grilled cheese.
How adventurous are this group of grilled-cheese lovers willing to get? More than one in five respondents will put onions on their grilled cheese sandwich (22 percent), and almost that amount will include pickles or avocado, while one in ten will include apples. The write-in fillings, however, were where the true Adventurists really shined. Their “something else” grilled cheese accompaniments included everything from mayonnaise or mustard, to tuna, sauerkraut, peanut butter or jelly/chutney. Additionally, 17 percent of respondents prefer a mix of cheeses as the core of their sandwiches.
Food Label Confusion
Conflicting sources of information about food and nutrition and confusing label claims make it difficult for families to navigate grocery aisles around the world according to a new global survey sponsored by the Enough Movement. Key findings showed that people across the globe care about what goes in their food and on their tables, but even the most diligent consumer admitted they don’t really know the meaning of many food labels, the differences in farming methods like organic and conventional and the environmental impact.
“The farm-to-table movement has revealed that we all want to know what’s in our food and where it comes from,” said registered dietitian Susan Finn, PhD, RD, FADA. “But it’s hard to separate fact from fiction when it comes to food labels, farming practices, and other food production topics. Distinguishing myth from reality can make a big difference in the choices families make about nutrition, household budgets and environmental impact.”
Key findings include:
Food labels are one of the most confusing topics for consumers.
Two-thirds of survey respondents report buying “all natural” or organic foods motivated by a perception that they are healthier and safer. In fact, 99 percent of organic purchasers expressed confidence in their understanding of the organic label. Yet the data shows a significant gap between their perceptions of what it actually means.
The main motivation consumers report for buying organic – 82 percent – is because they believe organic foods to be pesticide free. Organic does not mean pesticide free. Organic farmers may use a variety of chemical sprays and powders on their crops manufactured from natural sources, including substances like boron, copper sulfate and pyrethrin similar to the synthetic versions used in modern farming.
Two-thirds of consumers buy organic because they believe them to be more nutritious. However, a landmark meta-analysis from Stanford University, which compiled data from 237 studies, concluded that there was no health or nutrition difference found between conventional and organically produced food.2
No Added Hormones and No Antibiotics were other confusing labels. More than 60 percent of consumers thought No Added Hormones meant there were no hormones in products with that label, while another 25 percent thought products with this label were higher quality. Meanwhile, about one-third of consumers believed antibiotic free meant non-labeled products contained antibiotics.
All living things contain hormones – people, plants, animals, and therefore the food we eat.
There are no added hormones used in pork or poultry production around the world, even though about three-quarters of consumers surveyed believe they are.
In beef and dairy production, hormone levels in food from animals supplemented with hormones are nearly identical to those that aren’t. And, hormones in naturally hormone-rich foods like cabbage and soy contain far higher levels than meat, milk and eggs.
Regardless of whether an animal was sick and treated with an antibiotic or was raised entirely without antibiotics, the food you buy is free from any harmful antibiotic residue. Testing ensures it.
Consumers are confused about modern agriculture, farming, and food production.
Modern, organic, industrial, family farm. Consumers have a lot of questions about how food is raised and how farmers care for animals and our resources.
More than half of survey respondents (52 percent) believe that the majority of farms are run by corporations.
In the United States, 97 percent of farms are family owned and 88 percent are small family farms. The percentage of family-owned farms globally is 90 percent. Nearly 70 percent of survey respondents choose organic foods because they believe they’re better for the environment.
Organic farming produces less food – about 25 percent less on average. It requires significantly more land and resources to produce the same yield as modern farming methods. For example, to have raised all U.S. crops as organic in 2014, farmers would have required an additional 109 million acres of land, about the size of California.
While organic methods use less fertilizer, herbicides and energy, modern farming methods resulted in less soil erosion. In fact, modern farming practices are often the most environmentally sustainable, using innovation to decrease the amount of land, feed and water to raise meat, milk and eggs today.
Food waste and loss is a top concern among survey respondents.
91 percent of people surveyed believe the number one way to eliminate hunger globally is to eliminate food waste.
According to the Food and Agriculture Organization of the United Nations, 30 to 40 percent of food is lost in production each year making it a significant challenge. But, food waste is more than just veggies wilting in the fridge, and occurs across the entire production system. In animals, more than 20 percent of production is lost to death and disease, regardless of production system11. Best management practices and tools that help keep animals healthy are critically important to this challenge, as are making shopping decisions that support sustainable farming.
“The survey results underscore just how critical it is for more people to understand what goes on behind the scenes with their food,” said Janice Wolfinger, agriculture educator and farmer. “As a farmer, animal health and well-being is a top priority and we do everything we can to ensure that our animals are healthy. And as a mother, I choose to purchase foods that were grown using conventional food methods for a variety of reasons, but most importantly because I know that they’re safe for my family and they’re a better fit for our budget.”
The Truth About Food Survey, conducted by Kynetec, included 3,337 urban consumers in 11 countries – United States, France, Germany, United Kingdom,Italy, Turkey, Brazil, Mexico, Colombia, Argentina and Peru. The survey response level provides a margin of error of +/-5.7 percent at 95 percent confidence level.
More Label Confusion
Today’s consumers are more concerned than ever before about the foods they eat, yet they struggle to find the nutrition information needed to make informed purchasing decisions.
Label Insight’s 2017 Shopper Trends Study reveals that nearly half of consumers (49 percent) adhere to a particular diet or nutrition plan, and 75 percent avoid specific ingredients when shopping for food products. But, 67 percent of consumers say it is challenging to determine whether a food product meets their needs simply by looking at the package label, and nearly half of consumers (48 percent) consider themselves “not informed at all” about a food product even after reading the label.
“Consumers vary in their definitions of healthy, and they want more detailed ingredient information. Today’s product packaging is not meeting those needs,” said Patrick Moorhead, Chief Marketing Officer at Label Insight. “Keeping pace with consumers’ increasing demand for product transparency is one of the most challenging issues facing the food and beverage industry today.”
The study examines dietary preferences and consumers’ ability to find the nutritional information they need to make informed purchasing decisions. Key findings from the study include:
Shoppers Seek Out Healthy Choices:
Health Conscious Consumers: Nearly half (49 percent) of consumers adhere to a particular diet or health-related eating program.
Dietary Restrictions: Nearly half (44 percent) of consumers say food allergies, intolerances, or sensitivities affect the way they shop.
Focus on Ingredients:
Ingredients Matter: 98 percent of consumers believe ingredients are an important consideration in the food products they buy, and 75 percent of consumers examine ingredients before they buy to ensure products meet their dietary needs.
Ingredient Avoidance: 75 percent of consumers avoid specific ingredients when shopping for food products, including:
High Fructose Corn Syrup – 56 percent
Artificial Sweeteners – 44 percent
Preservatives – 36 percent
Artificial Colors – 36 percent
Artificial Flavors – 35 percent
Superfoods on the Rise: 85 percent of consumers seek out specific superfoods. The top superfoods consumers look for are:
Blueberries – 63 percent
Avocado – 60 percent
Green tea – 50 percent
Kale – 44 percent
Cinnamon – 44 percent
Packaging Makes it Difficult to Meet Needs
Challenges Meeting Dietary Needs: 67 percent of consumers find it challenging to determine whether a food product meets their needs by reviewing the package label.
Lack of information: Half of consumers (48 percent) consider themselves to be “not informed at all about the product” after reading a product’s label.
Online Product Research: 83 percent of consumers take the time to look elsewhere for food information when food packaging and labels are insufficient, and 74 percent of consumers conduct online research for more information.
Consumers’ focus on health and wellness has driven them to seek out more information about products than is typically included on product packaging. This shift continues to fuel the product transparency movement, and has motivated CPG brands and retailers to provide complete and accurate product information which can unlock value with consumers – from custom merchandising and dietary personalization at the retail level, to enhanced transparency initiatives like SmartLabel™ for CPG brands.
How Franchisees Use Co-op Dollars
A report from BIA/Kelsey titled “Advertising and Marketing Trends of Franchisees” reveals 65 percent of franchisees surveyed use co-op dollars for advertising and promotion, with more than one-third reporting that up to half of their ad spend comes from co-op dollars. The report is based on data from BIA/Kelsey’s Local Commerce Monitor™ (LCM) Wave 20 survey of small and medium-sized businesses. This new report specifically examines the media and marketing spending behaviors of the SMBs that self-identified as franchisees or licensees of a national company.
“Co-op dollars present a significant opportunity for franchisees to increase their spending over the next 12 months,” said Celine Matthiessen, VP, analytics and insights, BIA/Kelsey. “Solution companies that are able to report clearly on ad performance and show examples of revenue/customer-driven campaigns that result in increased calls to the business and website traffic will have an advantage with franchise SMBs that want to extend co-op programs.”
The report reveals that half of all franchisees are planning to increase their ad spend in the next year and spend across an average of 20 different ad channels to reach customers. Quick adopters of new technology, the majority of franchisees use a quarter to a half of their total annual ad budget from co-op programs on both traditional and digital channels. Programs focus on targeted digital such as search and display and traditional channels like direct mail, radio and community sponsorships.
“Any type of marketing and ad platforms that support customer promotions and deals are especially appealing to franchise SMBs,” commented Matthiessen. “It’s also worth noting that the development and use of digital advertising is an area where franchise SMBs report wanting support from their franchisor.”
Unique Dressings
Avocado, jalapeno, acai, ginger and miso are some of the standout dressing flavors operators are purchasing to spotlight on restaurant menus. According to data from Technomic’s latest Volumix Salad Dressings Report, total volume of this category had a modest increase in 2016 from the previous year. Liquid salad dressings had stronger volume growth over dry dressings.
This information, as well as the wealth of other valuable data points featured in the Volumix Salad Dressings Report, can give suppliers visibility into what brands and products operators are purchasing and for what price, also showcasing new product entrants giving perspective on trends evolving in the category.
Other notable takeaways from the Volumix Salad Dressings Report include:
- Total sales of portion-control liquid salad dressings are up 2.7 percent year over year
- The average case price of dry mix salad dressings increased by 2.5 percent over the prior year
- Ken’s Foods Inc., Ventura Foods and Kraft Heinz are the top three manufacturers by volume in this category
Mighty Mushroom Stats
The mighty mushroom not only is healthy on the plate, it’s also gentle on the planet – according to a new study measuring the water, energy and carbon emissions required to grow and harvest fresh mushrooms in the United States.
The study finds production of a pound of mushrooms requires only 1.8 gallons of water and 1.0 kilowatt hours of energy, and generates only .7 pounds of CO2 equivalent emissions. In addition, the annual average yield of mushrooms is 7.1 pounds per square foot – meaning up to 1 million pounds of mushrooms can be produced on just one acre.
The Mushroom Sustainability Story: Water, Energy and Climate Environmental Metrics 2017 study is the result of a two-year initiative to document mushroom production environment metrics.
“Our growers have long sought to benchmark their production practices to not only accurately measure our environmental impact, but also seek opportunities to improve upon our practices,” said Bart Minor, president and chief executive officer of the Mushroom Council, which represents the U.S. fresh mushroom industry. “Like all agricultural producers nationwide, we all want to ‘do better’ when it comes to being stewards of the environment. We are humbled to finally measure what we consider a low environmental footprint, but equally motivated to find opportunities to lower it even more.”
Researched and developed by SureHarvest, a leading sustainability analysis and research firm, The Mushroom Sustainability Story documents practices at 21 facilities nationwide, responsible for one-third of the U.S. fresh mushroom crop. Researchers collected data for all steps of the mushroom production process, including composting, spawning, casing and pinning, and harvesting.
“SureHarvest’s two-year analysis concludes that the amount of natural resources and space required to grow mushrooms is remarkably low compared to the published data on other foods,” said Dr. Jeff Dlott, president and chief executive officer of SureHarvest and chief researcher for the project. “Mushrooms can now definitively be considered one of the most sustainably produced foods in the United States.”
Be a Listener
Businesses that use social listening tools to actively monitor online conversations benefit from access to real-time feedback to improve products and services (25 percent), attract new customers (24 percent), and improve customer service (21 percent). Other unforeseen benefits include monitoring content performance, recruiting and hiring new employees, and learning about the competition. Data is from a survey of 300 users of social listening software in the U.S., conducted by Clutch, a leading research and reviews platform for business services
Social listening is the process of collecting social data by monitoring terms, names, and products associated with your brand and/or industry. While the top websites businesses monitor may be obvious – Facebook (93 percent) and Twitter (79 percent) – Q&A forums, like Reddit, news sites, and blogs are also strong sources of social data.
Social listening is about thoughtfully analyzing and reflecting on the social data collected and then taking action by adding value for your audience, the report says.
“People talk about their emotions and experiences online,” says Magda Urbaniak, Global Community Manager at Brand24, a social media monitoring service. “Those who expect a reaction need to know that you’re there and ready to engage.”
Because social listening offers businesses a chance to collect insider information from existing and prospective customers, it’s no surprise that nearly half of businesses surveyed (42 percent) say their main objective is to enhance the customer experience by improving customer service (21 percent) and reaching new clients (21 percent).
“These days, the Internet has become a place where people have discussions and share their experiences and opinions about brands and products,” says Urbaniak. “Companies are becoming more and more aware of the importance of reaching the sources that mention them.”
Engaging with both loyal followers and detractors is essential for forming trusting relationships with customers and continuously improving your business, says Clutch. The data confirms that most businesses monitor customer requests, questions, and concerns (86 percent) instead of their competition (77 percent).
Regardless of business size, resource availability, or overall business goals, you can learn a lot from both your competitors’ and your brand’s customers, says Clutch.
“Companies need to go beyond basic brand monitoring to get the entire dimensional social story of their consumers and their competitors’ customers,” says Paige Leidig, Chief Marketing Officer at NetBase, a California-based social media analytics platform.
A prospective customer’s social story may explain why she’s more likely to use a competitor’s services. Clutch recommends first, listen to understand the underlying reasons behind her decision. Second, engage her to fill a gap. Did she reach out to a competitor and never receive an answer? Respond by answering her question and directing her to a helpful resource your business created.
Clutch’s 2017 Social Listening Survey included 300 users of social listening software at companies with 100+ employees in the US.
Candy is Dandy
Roughly 90 percent of Easter baskets will include chocolate or candy, according to a national survey by the National Confectioners Association.
“Americans enjoy having chocolate and candy to help make celebrations like Easter even more fun and special,” said John Downs, president & CEO of the National Confectioners Association. “Consumers understand the unique role that chocolate and candy can play in a happy, balanced lifestyle. Most people in the U.S. enjoy candy 2-3 times per week, averaging about 40 calories per day.”
Among the survey’s findings:
Easter baskets are best accompanied with chocolate and candy
Nearly 90 percent of parents who celebrate with Easter baskets will help the Easter Bunny stock them with candy or chocolate. Seventy-nine percent said their baskets will also include non-edible items such as crayons, stuffed animals and books.
Easter is one of the most popular times of the year to share chocolate and candy
Seventy-five percent of Americans have shared chocolate or candy with friends and family at Easter.
Americans prefer their chocolate eggs to be filled
When given the choice, 52 percent of Americans believe that chocolate eggs are best filled with cream, caramel or other treats. Thirty-two percent of Americans want their chocolate eggs to be solid, while 16 percent are fine with a hollow chocolate egg.
Parents have a plan when it comes to talking about balance
According to survey findings, 91 percent of parents have a plan in place to talk to their children about balance when it comes to sweets and treats.
Decorating eggs and egg hunts are also popular ways to celebrate
Among parents, 79 percent say they plan to decorate eggs and 71 percent plan to attend an Easter Egg Hunt as part of their Easter celebrations.
Candy companies enjoy helping Americans celebrate Easter by creating unique Easter-themed confections. More than 55,000 Americans work in the confectionery industry in more than 1,000 manufacturing facilities across all 50 states. In addition, upwards of 400,000 jobs in agriculture, transportation, and retail are supported by the candy industry.
Peanut Power
Research from The Pennsylvania State University shows a new way in which peanuts may reduce the risk of heart disease. This study, published in The Journal of Nutrition, is the first to show that peanuts, especially peanut protein and bioactives, help keep your arteries flexible.
Levels of fat in the blood rise rapidly after a high fat meal, causing blood vessels to become stiff. This makes your heart work harder to pump blood through the 100 thousand miles of blood vessels in your body, increasing the risk of heart disease and stroke.
In this study, participants who ate peanuts as part of a meal containing 50% fat reduced the rise in blood triglycerides by 32 percent. In addition, peanuts also caused the participants’ arteries to remain open and flexible.
The researchers think the peanut protein, along with bioactives, vitamins and minerals play a major role in preventing this stiffening response. “Since the macronutrients were matched between the two shakes, we don’t think that it was the mono- and polyunsaturated fatty acids in the peanuts that affected the response,” according to lead researcher Dr. Penny Kris-Etherton. “The plant protein in peanuts, and specifically the amino acid arginine, along with the many other nutrients in peanuts likely played a role.”
Peanuts contain more protein than any other nut and, more arginine than most other foods. This is important because arginine is used to make nitric oxide, a vasodilator that helps keep blood vessels open and elastic.
Peanuts contain a rich assortment of bioactives, including resveratrol, plant sterols, flavonoids and antioxidants. Peanuts are also a source of dozens of vitamins and minerals, including niacin, folate, biotin, vitamin E, copper, manganese, molybdenum, and phosphorus.
Dr. Kris-Etherton states “the many nutrients and bioactives in peanuts have multiple health benefits, including the ability to blunt postprandial triglyceride response and prevent arteries from getting stiff after a high fat meal.”
To isolate the effects of peanut protein and bioactives, researchers prepared two shakes: a “control” shake containing a mixture of healthy oils, fiber, and protein from egg whites, and a shake containing peanuts. The fat content in the control shake was an exact match to that of the peanut shake, allowing researchers to test the effects of peanut protein and bioactives specifically.
Overweight and obese- but otherwise healthy- men had blood vessel flexibility measured using an ultrasound technique called flow-mediated dilation (FMD), and took blood samples to measure blood triglycerides.
This study is novel because it shows a new way in which peanuts reduce the risk of heart disease. Peanuts received a FDA Qualified Health Claim for Heart Health in 2003. It was based primarily on studies showing benefits of the good mono- and polyunsaturated fats in peanuts. However, this study is the first to demonstrate that peanut protein and bioactives keep your arteries healthy and also contribute to reducing the risk of heart disease.