
According to a Recent Study/Survey … End-of-October 2017 Edition
26 Min Read By MRM Staff
This Halloween edition of MRM’s popular “According to …” research roundup features research from the experts at Upserve on what matters most to diners and courting Millennials and Gen Z.
What Diners Want
Upserve did research to clarify what matters most to diners, and surveyed 520 adults from around the US to find out what – aside from food and great service – will bring them back to a restaurant. Turns out diners are a lot more interested in figuring out a way to get Fido onto the patio.
Consumers top asks of restaurants:
Let me bring my dog: 56 percent of respondents said that being family and dog friendly was important or very important in their decision, and 32 percent said it is one of the top three things they consider when deciding to return.
Offer online ordering: 71 percent of respondents said offering takeout or delivery was a factor in their decision-making process.
Support local farms: Sourcing from local products is an important factor to 42 percent of respondents; nearly a quarter said it is one of the top three things they consider.
What do diners not care about?
Surprisingly, a restaurant’s alcohol selection: more than half of the respondents said that the wine (54.6 percent), beer (54.8 percent) and cocktail (53 percent) menu was not important in their decision making. People were also not as excited about Happy Hour as you would think: only 29.6 percent said it was very important or important, while 37.4 percent said it was not important at all.
What’s the takeaway for restaurants owners?
Fun elements such as an awesome cocktail menu will likely help you stand out, but prioritize other more critical pieces – like perfecting your takeout process – to draw in repeat customers first.
How to Court Millennials and Gen Z
More so than other age groups (namely, Gen X, Baby Boomers), Millennials and Gen Z (ages 18-29) are more likely to have divergent reasons to want to come back to restaurants. So if you’re looking to target this age group, you should consider:
Drink specials: Much more likely to come back for Happy Hour: 27.4 percent said very important; 52.7 percent said it was very important or important (vs. 29.6 percent of general respondents)
Your Décor: Selfies lighting in the bathroom: 10.5 percent said it was very important; 80 percent thought it was at least somewhat important
Changing your ingredients: Adhering to different dietary/allergen restrictions: Important or very important to 47.37 percent of respondents.
Improving Your Menu to Bring Guests Back
Sourcing from local products: 23.8 percent said it is one of the top three things they consider; 41.9 percent said it is very important or important
Being friendly to food allergies/diets: 17.7 percent said it is one of the top three things they consider
Online Ordering
Over half of the respondents (51 percent) said that offering takeout or delivery was important or very important in their consideration, and 71 percent it was a factor in their decision making process.
Twenty-two percent of respondents said it was one of the top three things they considered.
When it comes to different age groups, millennials (18-29) stand out as being online ordering consumers: 35 percent said it was a very important consideration, and 86 percent said it was a factor in their decision.
Top Trends
Mintel announced five key trends set to impact the global food and drink market over the coming year.
In 2018, expect to see transparency and traceability for all, regardless of their income
In 2018, expect to see transparency and traceability for all, regardless of their income. From ingredient scares to political bombshells, self-care has become a priority for many and one that includes choosing food and drink that will address perceived nutritional, physical and emotional needs. Opportunities also will be plentiful for natural, tantalizing and unexpected textures from chewy beverages to cookies with popping candy inside.
Meanwhile, the rapid expansion in the variety of food and drink retail channels will fuel the opportunity for recommendations, promotions and product innovations that are personalized based on individual consumer behavior. Finally, forward-looking companies are developing solutions to replace traditional farms and factories with scientifically engineered ingredients and finished products.
Looking ahead to 2018, Mintel’s Global Food and Drink Analyst Jenny Zegler discusses the major trends predicted to play out in food and drink markets around the world, beginning with the trends that will gain wider traction in the months ahead to emerging trends that are influential, but just on the fringe in many regions.
Full Disclosure
In our new post-truth reality, consumers require complete and total transparency from food and drink companies.
Widespread distrust places pressure on manufacturers to offer thorough and honest disclosures about how, where, when and by whom food and drink is grown, harvested, made and/or sold. The need for reassurance about the safety and trustworthiness of food and drink has led to increased use of natural as well as ethical and environmental claims in global food and drink launches. In addition to more specific product details, the next wave of clean label will challenge manufacturers and retailers to democratize transparency and traceability so that products are accessible to all consumers regardless of household income.
Self-Fulfilling Practices
As more consumers find modern life to be hectic and stressful, flexible and balanced diets will become integral elements of self-care routines.
The frantic pace of modern life, constant connectivity, pervasive distrust and contentious tones in politics and the media have caused many consumers to look for ways to escape negativity in their lives. Many people who feel overwhelmed are focusing on “self-care,” or prioritizing time and efforts dedicated to themselves. Looking ahead, individual definitions of self-care and balance will reinforce the need for a variety of formats, formulations and portion sizes of food and drink that present consumers with positive solutions—and treats—that can be incorporated into their customized and flexible definitions of health and wellness. Going forward, more consumers will be looking for ingredients, products and combinations of food and drink that provide nutrition, physical or emotional benefits that advance their priorities for self-care.
New Sensations
Texture is the latest tool to engage the senses and deliver share-worthy experiences.
In 2018, the sound, feel and satisfaction that texture provides will become more important for food and drink companies and consumers alike. Texture is the next facet of formulation that can be leveraged to provide consumers with interactive—and documentation-worthy—experiences. The quest for experiences will provide opportunities for multisensory food and drink that uses unexpected texture to provide consumers, especially the teens and young adults of the iGeneration, with tangible connections to the real world, as well as moments worth sharing either in-person or online.
Preferential Treatment
A new era in personalization is dawning due to the expansion of online and mobile food shopping.
As technology helps to make shopping as effortless as possible, an era of targeted promotions and products is emerging. Motivated by the potential to save time and ideally money, consumers are sampling a variety of channels and technologies when shopping for food and drink, including home delivery, subscription services and automatic replenishment. Companies and retailers can leverage technology to establish new levels of efficiency, such as customized recommendations, cross-category pairings and resourceful solutions that save consumers time, effort and energy. Opportunities exist for companies to tempt consumers by creating products, suggesting combinations of goods and other options across consumer categories that make shopping more efficient and affordable for customers.
Science Fare
Technology is being used to engineer solutions for our stretched global food supply.
A technological revolution is playing out in manufacturing as some forward-looking companies are developing solutions to replace traditional farms and factories with scientifically engineered ingredients and finished products. In 2018, technology will begin to disrupt the traditional food chain as enterprising manufacturers aim to replace farms and factories with laboratories. While lab, cultured or synthetic food and drink is only just emerging, technology could eventually be used to design food and drink that is inherently more nutritious, which could extend the consumer audience for scientifically engineered food and drink beyond environmentally conscious shoppers to reach consumers who are concerned about ingredient consistency, efficacy and purity.
Jenny Zegler, Global Food and Drink Analyst at Mintel, said: “In 2018, Mintel foresees opportunities for manufacturers and retailers to help consumers regain trust in food and drink and to relieve stress through balanced diets as well as memorable eating and drinking experiences. There also is an exciting new chapter dawning in which technology will help brands and retailers forge more personalized connections with shoppers, while enterprising companies are using scientific engineering to create an exciting new generation of sustainable food and drink.”
Mintel’s Global Food & Drink Trends 2018 are available to download here.
College Students and Late-Night Ordering
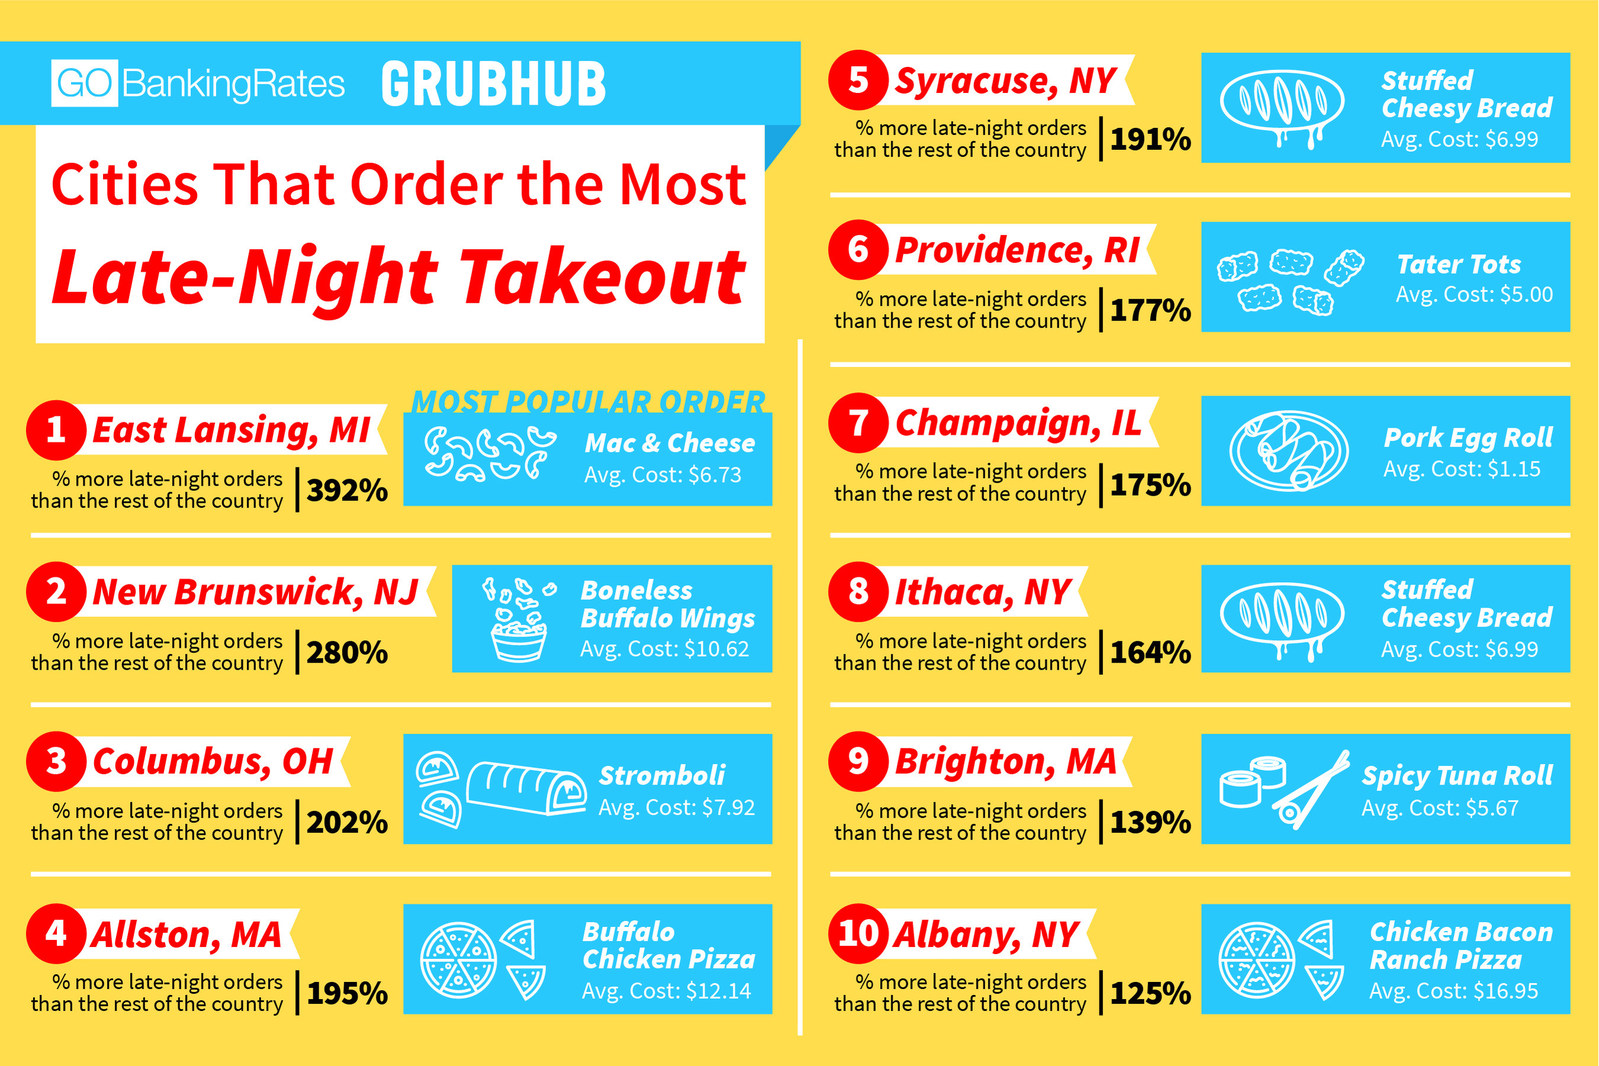
College students order 87 percent more late-night takeout food than other diners, a new study found.
Personal finance website GOBankingRates partnered with food delivery app Grubhub to determine which U.S. cities order the most late-night takeout and what kind of food was the most popular. Unsurprisingly, the majority of the cities on the list have a large population of college students.
For full study results and more details on methodology, visit: The Most Popular Late-Night Takeout Orders Around the Country.
Top Five Cities With Late-Night Eaters
East Lansing, Mich.
Percent more late-night orders than the rest of the country: 392 percent
Most popular orders: mac and cheese, $6.73; tater tots, $3.39; loaded fries, $9.12
New Brunswick, N.J.
Percent more late-night orders than the rest of the country: 280 percent
Most popular orders: boneless buffalo wings, $10.62; chicken Caesar wrap, $6.54; falafel sandwich, $3.96
Columbus, Ohio
Percent more late-night orders than the rest of the country: 202 percent
Most popular orders: stromboli, $7.92; chicken alfredo, $9.97; waffle fries, $3.26
Allston, Mass.
Percent more late night orders than the rest of the country: 195 percent
Most popular orders: buffalo chicken pizza, $12.14; scallion pancakes,$6.14; cheese calzone, $8.90
Syracuse, N.Y.
Percent more late night orders than the rest of the country: 191 percent
Most popular orders: Stuffed cheesy bread, $6.99; pepperoni calzone,$7.25; boneless wings, $8.04
Additional Study Insights
Every city on the top 20 list is located on the east coast.
Sweet potato pie was ordered a whopping 889 percent more in Baltimorethan anywhere else in the country. The city of Providence was a close second with its residents ordering tater tots 883 percent more often than the rest of the country.
The most expensive item? Albany residents spend an average of $16.95for chicken bacon ranch pizza. The least expensive item is pork egg rolls in Champaign, Ill., costing an average of $1.15.
For Coffee Lovers
Java, cuppa Joe, go juice, hojo, or whatever one wants to call coffee, a ready-made cup of it is not far from reach for the majority of U.S. consumers. In addition to coffee served at restaurants and other foodservice outlets, there are 33,129 gourmet coffee shops in the U.S., a 2 percent increase in units from last year, based on a recent restaurant census conducted by The NPD Group/
Chain coffee shop units increased by 5.9 percent in the census period to a total of 18,445 units, NPD reports. It was the opposite story for independent coffee shops units, which declined by 2.2 percent for a total of 14,684 units. Total coffee shops grew by 2,990 units over the past five years, according to NPD’s Spring 2017 ReCount® restaurant census.
Another way to look at the proliferation of coffee shops is to look at per capita or the number of coffee shops for every million people. Among metro areas Juneau, Alaska ranks the highest in density with 22 coffee shops serving the city’s population of 32,519. Alaskan sibling city, Anchorage, is second with 170 coffee shops for a population of 431,231. In rank order, Bend, Oregon, Seattle, Washington, and Portland, Oregon follow with the most coffee shops per capita.
Consumer demand for foodservice coffee appears to be in line with their access. There were 8.3 billion servings of coffee ordered at U.S. restaurants and foodservice outlets in the year ending August 2017, up 2.3 percent from the same period last year, according to NPD’s ongoing foodservice market research. Regular or traditional coffee is still the most popular type of coffee ordered with 4.4 billion servings ordered in the period but specialty coffee is not far behind with 4 billion servings ordered.
“Coffee chains are expanding units to meet consumer demand because they have the resources to do so,” said Greg Starzynski, director- product management, NPD Foodservice. “Greater consumer access to chain coffee shops makes it more difficult for independent coffee shops to compete, which is why we’re seeing a drop in independent units.”
Calore Postings Impact
In 2008 New York City introduced a rule mandating calorie postings for chain restaurants that was intended to induce healthier choices by making calories salient inside the restaurant. A new study shows that it also increases mentions about health in online restaurant reviews, potentially redirecting customers towards healthier restaurants.
The study in the INFORMS journal Marketing Science, a leading scholarly marketing publication, investigated whether the calorie posting on menus has broader spillovers by impacting consumer evaluations of the restaurant. The study finds that health mentions about the foods increased significantly in online reviews after the calorie posting regulation. The result suggests that calorie posting can not only shift consumers towards healthier alternatives when inside a restaurant, but can also have spillovers on other customers reading the reviews by potentially redirecting them towards healthier restaurants and food items.
The study, “The Effect of Calorie Posting Regulation on Consumer Opinion: A Flexible Latent Dirichlet Allocation Model with Informative Priors,” was co-authored by data researchers from the University of Southern California, the National University of Singapore, and Cornell University.
The authors analyzed 761,962 restaurant reviews across 9,805 restaurants on an online restaurant review website in New York City from 2004 to 2012. Using text-mining methods, the authors examined the change in the mentions of health in reviews over time before and after the calorie posting rule went into effect. To rule out the possibility that the health mentions increase was simply due to increased public interest in health issues over time, they compared the change in topics discussed for chain restaurants, relative to non-chain restaurants which were not mandated by the rule to post calorie information. The authors found a significant increase in the proportion of reviews that discussed health for chain restaurants, relative to non-chain restaurants.
The authors also explored in greater detail the source of the increase in health topics. They found that it was largely driven by new reviewers who were previously not active in posting reviews, but began to post more reviews after the mandate. The authors noted that “interestingly, the increase in health discussion in opinions was not confined to restaurants in more affluent localities, commonly associated with more health-conscious consumers. This is an encouraging sign of the success of the rule across the socioeconomic divide – especially given the greater incidence of obesity among lower socio economic classes.”
New York City recently expanded the rule to beyond chain restaurants to also include fine dining restaurants. The authors noted that, “our result that calorie posting on menus impact online reviews is significant for this rule expansion since consumers are even more likely to consult reviews for fine dining restaurants than for chain restaurants that they habitually visit. Whether this will have an impact on calorific content of items on fine dining restaurant menus of restaurants of course remains to be seen.”
Brits Eating Lunch Out
What Food Factors Matter
Nearly half of consumers report that “low sugar or sugar-free” and “free from GMO ingredients” are very or extremely important factors when deciding which food or beverage product to eat or drink. These factors top the list, just ahead of factors such as low-salt, organic, low fat, or fortified with vitamins or minerals.
GfK asked 23,000 consumers online in 17 countries how important certain factors are, from a given list, when deciding what to eat or drink. Nearly half (48 percent) report that products being low-sugar or sugar-free is “extremely” or “very” important to them, and an equal number say the same for products being free from genetically-modified (GMO) ingredients.
Low sodium or low-salt products came third highest, with 45 percent. And forth place was a tie between organic products, low fat or no-fat products, and products that are fortified with vitamins or minerals. These all came equal with 44 percent of consumers rating these as very or extremely important when making their decision on what to eat or drink.
As expected, people from high income households set consistently higher importance on all the factors, compared to the lower income households.
Among high income households, the most important factors are GMO-free (55 percent), low sugar or sugar-free (54 percent) and low sodium or low salt (52 percent). Among low income households, GMO-free and low sugar or sugar-free are also the top two, but mentioned by a significantly lower percentage (44 percent and 43 percent respectively). And the third most important factor for this group is a tie between organic products and products fortified with vitamins or minerals (41 percent).
Gender makes next to no difference in how people rate the decision factors. Men are very slightly more likely than women to place importance on local products, fortified products, pre- or pro-biotic and gluten-free, but the difference in each case is only three percentage points.
Chinese are the most selective on what to eat and drink, out of 17 countries surveyed
In eight out of the nine decision factors researched, China tops the list for having the highest percentage placing importance on that item, when deciding what to eat or drink. The exception is for locally produced products, where Italy takes the lead.
The greatest difference between China and other nations is seen when it comes to preference for pre- or pro-biotic products. Here, China is 21 percentage points ahead of the next closest country with over half of its online population placing high importance on this factor.
Download GfK’s complimentary report on “factors when deciding what to eat and drink” to see key demographic data for each of the 17 countries included in this survey.
Nonalcoholic Beverage Market
The global nonalcoholic beverage market is expected to reach USD 1.60 trillion by 2025, according to a new report by Grand View Research, Inc. Rising societal awareness toward serious health problems is acting as the biggest driver for nonalcoholic beverage market. The industry is reshaping itself by changing the orientation from carbonated soft drinks to non-nutritive low-calorie beverages.
Various studies and research have proved that obesity is linked to higher consumption of CSDs. This has led to the development of calorie-free or low-calorie drinks, such as functional beverages, bottled water, and fruit beverages. Childhood obesity rate for the age groups of 2-5 and 12-19, has doubled in past 30 years in the U.S. The government is also trying to reduce the sales and consumption of drinks made from nutritive sweeteners by imposing sugar taxes.
Stringent government regulations for labeling, listing the ingredients used, etc. in developed countries are expected to restrain the market growth. On the other hand, initiatives to attract the global players by increasing foreign investments, trade promotion, and economic subsidies in the developing economies are expected to foster the industry growth.
New product launches, as a result of the product line extension, have enabled customers to select application-specific offerings from a wide variety of options. The widening distribution channels have led to easy product availability, which has been a key industry driver in the past. Marketing and advertising plays the most important role in organizational sales and sustainability. Trade promotion, advertising, sales promotion, and public relations are the main promotional activities employed by the key players.
Further Key Findings From the Report Suggest:
The global nonalcoholic beverage market was valued at USD 967.3 billion in 2016. The market is projected to grow at an estimated CAGR of 5.8 percent over the forecast period.
Carbonated soft drinks occupied the highest market share in 2016 owing to its high market penetration
North America accounted for the largest market for nonalcoholic beverage industry in 2016 owing to the presence of developed economy and high standard of living
Functional beverages are expected to emerge as the fastest growing product segment in the market on account of high demand for ready to drink coffee and tea, relaxation drinks, and energy drinks
The key players include PepsiCo, Inc., The Kraft Heinz Company, Dr. Pepper Snapple Group, Inc., The Coca-Cola Company, and Nestle S.A.
Holiday Spending
With the holiday shopping season just around the corner, consumers say they will spend an average $967.13 this year, according to the annual survey conducted by Prosper Insights & Analytics for the National Retail Federation and released today. That’s up 3.4 percent from the $935.58 consumers said they would spend when surveyed at the same time last year.
“With employment and incomes increasing, consumers are more confident this year and that is reflected in their buying plans for the holidays,” NRF President and CEO Matthew Shay said. “Retailers have been stocking up in expectation of this, and all signs are that this will be a busy holiday season. Retailers are preparing for a rush of consumers leading into Thanksgiving and all through December, and are offering a wide array of merchandise and promotions so shoppers can find great gifts and great deals at the same time.”
The consumer survey comes on top of NRF’s annual holiday spending forecast, which takes into account a variety of economic factors and projects that holiday retail sales in November and December this year will be up between 3.6 percent and 4 percent for a total between $678.8 billion and $682 billion.
In addition, imports set an all-time record high late this summer as retailers brought in an unprecedented amount of merchandise in anticipation of a strong holiday season, and are continuing at unusually high numbers this fall, according to NRF’s monthly Global Port Tracker report.
The survey found that only 27 percent of consumers say their spending will be impacted by concerns about the nation’s economy, down from 32 percent during 2016’s election-year jitters and the lowest level since NRF began asking the question during the Great Recession in 2009.
Holiday spending comes in three main categories – gifts, at $608.06; items such as food, decorations, flowers and greeting cards, at $218.08; and other non-gift items consumers buy for themselves and their families, at $140.99.
For the first time in survey history, online is the most popular shopping destination this year, cited by 59 percent of consumers. The survey also found that 57 percent will shop at a department store, 54 percent at a discount store, 46 percent at a grocery store/supermarket and 35 percent at clothing or accessories store. The survey found 27 percent plan to visit an electronics store, 25 percent a small or local business, and 18 percent will go to a crafts or fabrics store.
Most online shoppers will take advantage of free shipping (94 percent) and conveniences like buy online, pick up in store (49 percent). In addition, 19 percent will take advantage of expedited shipping and 12 percent will use same-day delivery.
Most consumers (59 percent) are waiting until at least November to begin holiday shopping. However, 22 percent started or were planning to start in October and 19 percent in September or earlier. Of the early shoppers, 65 percent say they are trying to spread out their budgets while 49 percent do not want the stress of last-minute shopping and 48 percent want to avoid the crowds.
“While many consumers are holding off until November or later to start their holiday shopping, retailers should be prepared for high traffic online and in stores come Thanksgiving weekend as customers start tackling their lists,” Prosper Insights Principal Analyst Pam Goodfellow said. “Although sales will remain an important factor for most consumers, many will lean on convenient locations and easy-to-use websites or mobile apps along with free shipping to complete their purchases.”
For the eleventh year in a row, gift cards remain the most popular items on wish lists, requested by 61 percent of those surveyed, followed by clothing and accessories at 55 percent, the highest level the category has seen in 12 years. Two in five (39 percent) would like books, music or movies, the lowest in survey history; others asked for consumer electronics (33 percent), home décor (24 percent), jewelry (23 percent), personal care or beauty items (21 percent), sporting goods (20 percent), and home improvement items (18 percent).
The survey of 7,349 consumers was conducted October 3-10 and has a margin of error of plus or minus 1.2 percentage points.
Sandwich Eating Habits
Jersey Mike’s Trend Tracker survey of 52,898 individuals reveals some surprising sandwich eating habits. Jersey Mike’s Subs, known for its fresh sliced/fresh grilled subs, rolled out the survey, designed to capture a slice of American life, in honor of National Sandwich Day on November 3. 
Jersey Mike’s Trend Tracker – America’s Sandwich Eating Habits
Americans Love Their Subs!
Ninety-eight percent of respondents say they eat at least one sandwich a week.
Two out of five (39 percent) say they eat three or more sandwiches per week.
A Time To Crave
Three quarters of all respondents(76 percent) crave subs for lunch.
One in five (20 percent) say dinner is their preferred time for subs.
Forget cold pizza, a surprising 444 people crave a sub for breakfast.
It’s (not) a Wrap: Top Five Sandwich Types
Sub sandwich (64 percent)
Grilled sandwich (11 percent)
Deli sandwich (11 percent)
Wrap (7 percent)
Club (7 percent)
To Share or Not to Share
Forty percent say they share their sub with their significant other.
Sharing with kids is the next closest option at a distant 11 percent.
Savoring every bite: 44 percent say they don’t share their sub…
Unless they have 100 of their favorite subs, then…
Nearly three quarters (70 percent) would share them with a charity, police/fire departments or school/work colleagues.
20 percent would throw an awesome party.
Jersey Mike’s Trend Tracker gathered 52,898 responses between October 3 and October 5. The company emailed a $2 coupon to respondents and invited them to participate in the survey.
What Kids Love about Sandwiches
McAlister’s Deli® surveyed their youngest guests to learn more about how children prefer to consume their favorite sandwiches. The award winning fast casual chain surveyed more than 300 children between the ages of five and nine and found that their love of sandwiches runs deep; on average, kids are eating four sandwiches per week.
When given a world of options – including cookies, pizza and macaroni & cheese – from which to make their favorite sandwich, kids stuck to the classics with about half selecting turkey as their favorite sandwich and 77 percent adding cheese as their favorite topping. White bread was also the winner with 61 percent of kids selecting it, while 35 percent opted for whole wheat or multi-grain.
To provide kids – and adults alike – a sandwich they truly desire, McAlister’s Deli is offering all guests its classic McAlister’s Club sandwich for just $4 on November 3, National Sandwich Day. The fan favorite McAlister’s Club is stacked thirteen layers high of smoked turkey and Black Forest Ham with bacon, sharp cheddar and Swiss cheese, lettuce, tomatoes, McAlister’s Honey Mustard and mayo on sliced wheat bread.
While kids may be traditional in their sandwich making, McAlister’s also learned:
Health Matters: Most kids would choose wholesome items to put on their sandwich such as turkey (49 percent), cheese (77 percent), lettuce (40 percent), and tomatoes (29 percent) rather than less healthy choices like french fries (18 percent), tater tots (7 percent) and onion rings (5 percent)
Say Yes to Crust: 58 percent prefer sandwiches with the crust on and 42 percent like it with the crust off.
Will Work for Sandwiches: Nearly 60 percent of kids said they would do their homework and clean their room for their favorite sandwich.
Keep It Simple: Most kids like their sandwich cut in half (47 percent), 27 percent prefer it whole, 17 percent like it cut in triangles and 9 percent like it in four squares. No crazy shapes needed!
Sandwich Purists: More than 70 percent of respondents agreed that ice cream sandwiches do not count as sandwiches.
“These kids have great taste! While we knew kids loved sandwiches, we are encouraged to learn that they also share a preference for healthy, fresh ingredients!” said Paul Macaluso, president of McAlister’s Deli. “We’re excited to celebrate National Sandwich Day by offering our loyal fans, kids included, what they want – our handcrafted McAlister’s Club Sandwich filled with 13 layers of fresh ingredients at a great price.”
Customer Service Survey
Ann Michaels & Associates, a leader in Customer Experience and Social Media Management programs, released the results of the 2017 Social Media Response Time Study.
It’s no secret that consumers have been driving social media as a customer service channel, and brands have been quickly acclimating to their demands. Not only do consumers want to use social for customer service, but they want a response fast, typically less than an hour. Are retailers keeping up?
The 2017 study looked at response rates and times for 30 brands in the retail industry, and results were compared to earlier studies conducted in 2012 and 2015.
“Brands have made significant improvements, but they are still not where consumers want them to be” says Marianne Hynd, Vice President of Operations at Ann Michaels & Associates. “Some of the findings indicate that response times may be leveling off – I’ll be curious to see if brands take back control of social service standards in the coming years.”
Key findings include:
Social media response time has continued to improve, though not as significantly as has been the case in prior years, signaling a potential plateau in response times.
There is still a significant gap between consumer expectations and actual response times.
Brands are improving in social service response, and may be turning away from email/web forms as customer service channel.
Facebook response rates and response times generally dominated Twitter’s response rates and times, which is a shift from prior studies. There is one exception in which Twitter dominates in response time.
A significant opportunity for brands was uncovered in indirect contact response.
Foodservice Career Survey
The International Foodservice Distributors Association (IFDA), in partnership with Paradox Compensation Advisors, today released the results for their 2017 Hourly Compensation Survey. The survey revealed that average wages for foodservice distribution employees are highly competitive and surpass those of many other occupations for U.S. workers.
“The data in this survey proves that pursuing a job in foodservice distribution is an excellent career choice,” said IFDA President and CEO Mark Allen. “In addition to opportunities for upward mobility and career growth, our foodservice distributors are offering generous pay and benefits to attract and retain the best and brightest.”
Key Highlights:
Foodservice distribution delivery drivers earn average annual wages of $62,854, far exceeding the average for all U.S. workers at $49,630, according to 2016 Bureau of Labor Statistics.
The difference is more striking when compared to similar positions with heavy and tractor-trailer truck drivers averaging $43,590 and light truck or delivery services drivers averaging $34,790.
The trend continues when compared to other occupations: Construction Equipment Operators at $49,810, Roofers at $42,080, and Stonemasons at $43,650.
The survey is based on data from 39 distributors representing 376 facilities. The report includes salary information for 15 different positions including: Class A CDL Route Delivery Driver (No Helper), Class A CDL Driver Route Delivery Driver (With Helper), Shuttle Driver, Class B CDL Route Delivery Driver, Diesel Mechanic, Dispatcher, Forklift Operator, Inventory Control Specialist, Loader, Maintenance Mechanic, Selector, Shipper/Receiver, Warehouse Team Leader, Warehouse Worker, and Yard Driver.
QSR Market Survey Trends
Technavio’s latest market research report on the global quick-service restaurants market provides an analysis of the most important trends expected to impact the market outlook from 2017-2021. Technavio defines an emerging trend as a factor that has the potential to significantly impact the market and contribute to its growth or decline.
Growing innovation and customization in food menu is driving the demand for quick-service restaurants in the global market. The rising importance of diet, food allergy, irrespective of medical condition or nourishment confinement, or weight reduction plan is propelling the need for customization in the food industry.
The top three emerging market trends driving the global quick-service restaurants market according to Technavio research analysts are:
- Innovation in food packaging
- Embracing technology
- Rise in demand for nutritious on-the-go breakfast
Innovation in Food Packaging
Vendors are adopting sustainable practices that are helpful in reducing the cost of offerings. This is done by various means like new sustainable packaging designs. Eco-friendly practices are being adopted as global warming and other adverse environmental conditions are increasing. Similarly, the quick-service restaurants are developing innovative and sustainable packaging solutions that can create a good brand image among the consumers and result in increased footfall in these restaurants.
According to Akash Pandey, a lead analyst at Technavio for food service “Vendors in the corrugated packaging industry have provided a wide range of packaging solutions for hot food, particularly for takeaways, combining innovative design with fine fluting to make the product easier to handle and consume. Pizza chains favor corrugated packaging due to its insulation properties, and they try to keep innovating in terms of sustainability and eco-friendly packaging, for example, innovative pizza delivery container that effectively separates into four cardboard plates so the individuals can enjoy their meals when it is hot.”
Embracing Technology
Most of the vendors are increasingly utilizing convenience and the ease to reach out to their outlets. Mobile applications offering the locations of nearby stores for a drive-thru, updated menu, offers, coupons, and other features are appealing the customers. The vendors provide the option of online payment and quick service to reduce billing time and to make dining convenient for customers. The point of sales technology has been updated to provide the customers hassle-free quick-service.
“These applications have also been offering the privilege of ordering and customizing the snacks as well as the number of calories consumed associated with each food offering. For instance, the mobile app of Domino’s offers the option of customizing pizzas with a choice of ingredients and crusts. Similarly, the Subway app informs the customers about the calories associated with each item on the menu,” says Akash.
Rise in Demand for Nutritious On-the-Go Breakfast
Quick service restaurant vendors are looking to add a nutritional boost to their on-the-go breakfast menu and are therefore coming up with innovative and nutritious breakfast food with whey protein as the primary ingredient, which is an ideal source of energy to start the day and one of the most popular superfoods among consumers.
For instance, McDonald’s offers Fruit and Maple Oatmeal consisting of 100 percent natural whole-grain oats, along with cream, red and green apples, cranberries, and raisins in its breakfast menu.
Be Crafty and Local
Eau Claire Distillery conducted a survey of over 1,000 U.S. consumers who drink alcohol and spirits to explore preferences, spending habits and purchase influences in the U.S. market.
The results overwhelmingly show that the majority of American drinkers feel very strongly about knowing where their food and beverages come from and are willing to pay more for a craft or locally-owned product. Nearly 70 percent of survey respondents stated that they either ask for or prefer craft spirits when ordering a drink at a restaurant or bar and three-quarters of respondents would drink more craft spirits if they were more available.
From California to New York, Americans are seeking out farm-fresh ingredients and craft or family-owned establishments to source their food and drinks. Over 84 percent of respondents agreed or strongly agreed that it is important to know where your food comes from. Interestingly, while 67 percent of the total respondents said good ingredients are very important when making food and drinks, Generation X felt much more strongly about the importance of good ingredients with 76 percent of them saying they were very important – 15 percent more than Millennials.
When it comes to drinking habits and preferences, over 70 percent of those surveyed said they like to drink cocktails and 85 percent of those have been one and three cocktails per week. About half of the respondents enjoy making cocktails at home and drinking them at bars and restaurants. The majority of respondents also showed a strong demand for craft spirits and about 78 percent of those who were unfamiliar with craft spirits said they would like to give them a try. That said, most respondents do ask for specific spirit brands when ordering drinks.
The vast majority of respondents said they would be willing to pay a premium for craft beer or spirits. When asked about their in-store purchase preferences, most respondents said they try out new brands every three to six months and recommendations from friends and family along with bottle labels and in-person tastings are the strongest influences on their purchase decisions. In fact, 63 percent of respondents said they are likely or very likely to make a purchase after an in-store sampling.
“The survey’s findings made it clear that American drinkers have a clear preference for craft spirits, and the pent-up demand is quite similar to what we saw prior to the craft beer boom,” said founder of Eau Claire Distillery, David Farran. “We expect the craft distilling industry to see immense growth, mirroring the trajectory of the craft beer industry. Americans like their cocktails and they value knowing where their spirits come from and how they were made, from seed to sip.”
Beer Market Stats
While certain segments of the beer category demonstrated strong gains in 2016, the overall category decreased by 0.3 percent to end the year with 2.83 billion 2.25-gallon cases, according to the Beverage Information Group’s 2017 Beer Handbook. Continued economic growth, employment gains, and evolving consumer preferences are contributing factors in the evolution of the beer industry.
The Imported beer segment enjoyed another year of strong volume performance, growing 6.7 percent to 454.4 million 2.25-gallon cases. This continued success helped push the import’s market share to 16 percent in 2016. The segment last peaked in 2007 when it reached 13.8 percent with 408.3 million 2.25-gallon cases before slipping each year until 2014, which began a string of years with positive sales gains.
The Craft beer segment grew 6.0 percent in 2016 to 300-million 2.25-gallon cases, the same growth rate as in the prior year. Remarkedly it surpassed the 10 percent market share for the first time, reaching 10.4 percent up from 9.8 percent in 2015. The craft explosion, however, is beginning to show signs that it’s losing steam. As the numbers of Millennials continues to grow so does their penchant for experimentation across brands and categories. On the upside for the craft segment is the growing number of regional and micro- breweries, topping 5,234 in 2016. With so many new offerings hitting the marketplace, Millennials may still find crafts appealing.
Flavored Malt Beverages (FMBs) leveled off in 2016 after experiencing growth of 7.5 percent, 8.2 percent and 21 percent the last three years, respectively. In 2016 FMBs accounted for 110 million 2.25-gallon cases, growing just 2.4 percent. The reason for this slow down begins at the top. Segment leader Bud Light Rita’s line had been growing at double and triple-digits since its introduction in 2012. In 2015 that momentum suddenly halted to just 0.5 percent growth, with growth in 2016 of only 0.1 percent. Still at 30.7 million 2.25-gallon cases, the brand is still a powerhouse and the segment leader.
The Super and Premium beer segments suffered in 2016 from the same problem as the Light beer segment: there’s a general malaise towards them for not being craft beer. Overall, the segment lost 13.3 million 2.25-gallon cases in 2016, shrinking to finish the year with 385.8 million 2.25-gallon cases. The super and premium segment commanded a 13.6 percent share of beer industry.
The Light beer segment is also under fire, slipping 2.6 percent in 2016, despite it being the largest segment in the industry with a whopping 44.5 percent market share. The light segment sold 1.26 billion 2.25-gallon case in 2016, 33 million fewer cases than in 2015. Among the 23 beers included in the 2017 Beer Handbook’s top light brands, only Michelob Ultra registered positive sales, finishing in 6th place with 70.8 million 2.25-gallon cases sold, an uptick of 18.4 percent over 2015.
The Popular beer segment continued its steady decline in recent years with only 6.5 percent of the overall beer market. The segment was down 1.7 percent to 185.6 million 2.25-gallon cases. The Malt Liquor and Ice segments were also down, roughly 4 percent verses 2015.
Halal Food Market to Grow
The global halal food market is expected to reach USD 2.10 trillion by 2025, according to a new report by Grand View Research, Inc. The global halal food industry is expected to witness significant growth over the forecast period owing to increasing Muslim population and their substantially increasing expenditure on food & non-beverages, which is considered as the main driving force of this market. The total Islamic population is expected to increase from 23 percent in the present situation to around 30 percent of the total world population by 2030.
World over initiatives has been seen escalating since the last few years with the advent of few events in Asia Pacific and the Middle East & African region, which are the top two regions contributing to the growth of the global market. A major bilateral initiative to mention would be the cooperation between Abu Dhabi and South Korea, which allowed South Korea to gain further access to the global halal food market.
Governments of the Islamic as well as the non-Islamic nations and the manufacturers of halal-certified food products have been taking various initiatives in terms of marketing & educating consumers about these products. The confidence of consumers in halal brands has been the most influential factor in the actual purchase of these products.
Meat and alternatives were the largest product segment in 2016 with a net market worth of over USD 590 billion globally. Halal meat has always been a remarkable business segment. The formation of Organization of Islamic Cooperation (OIC) has been well placed to take the initiative of setting an international standard for these food items. Owing to the formation of these types of organizational figures the industry participants have been successful to a great extent in building consumer trust and pushing penetration of the product category to even higher levels.
Further Key Findings From the Report Suggest:
The global halal foods industry was valued at USD 1,245.6 billion in 2016 and is estimated to grow at a CAGR of 6.1 percent over the next eight years
Milk & milk products such as processed milk, cheese, and yogurt are expected to be one of the another primary product segment driving growth for the global industry
Beverages such as carbonated drinks, packaged juice, and sweeteners with halal certification are expected to witness substantial demand over the forecast period. The segment is estimated to grow at a CAGR of over 4.8 percent in Turkey.
Asia Pacific was the leading consumer in 2016. Around 63 percent of the global Muslim population resides in this region, which is the main driving factor in the region. Indonesia and Malaysia together accounted for over 55 percent of the regional demand in 2016.
Major companies actively operating in the global halal food industry include Nestlé, Glanbia Cheese Ltd, Guenther Bakeries UK Ltd, Kellogg’s
Companies have been trying to strengthen consumer trust with several marketing campaigns trying to be transparent about their production process of packed halal foods.