
According to a Recent Study/Survey … End-of-September 2018 Edition
39 Min Read By MRM Staff
This edition of Modern Restaurant Management (MRM) magazine's "According to …" research roundup features where you can find the most-opinionated diners, lunchtime preferences, a whole latte of coffee-related surveys thanks to National Coffee Day (September 29) and pizza popularity.
Most-Opinionated Diners
Deciding where to dine out can be difficult with so many options and reviews on the internet. But depending on where you live and what platform you use, results will vary.
Using Eater.com's Essential 38 lists in 25 cities to understand how restaurant ratings varied by location and platform (Yelp, TripAdvisor, Facebook, Google), Chicago Home Run Inn analyzed more than 4,000 data points and identified where the harshest and most opinioned eaters live.
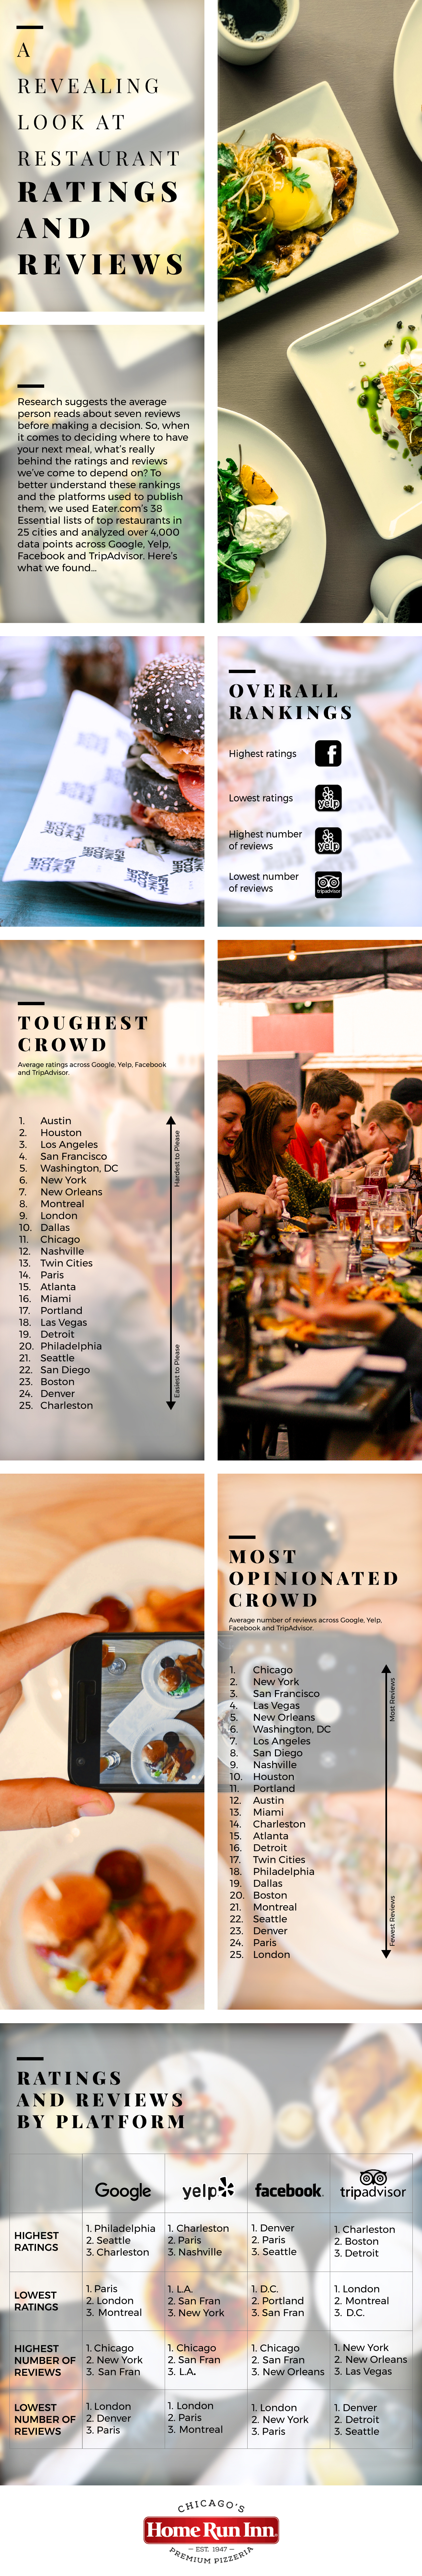
It turns out that the worst rated restaurants across all the platforms are in Austin, Texas, followed by Houston, Los Angeles, San Francisco, Washington D.C., New York City, New Orleans, Montreal, London, and Dallas. Following these top 10 most critical cities are Chicago, Nashville, the Twin Cities, Paris, Atlanta, Miami, Portland, Las Vegas, Detroit, and Philadelphia.
And which cities in the world have the best-rated restaurants? According to the data, the best-rated restaurants were all in Charleston, Denver, Boston, San Diego, and Seattle.
They also wanted to look at which cities were the most opinionated. In order to determine this, they examined the average number of reviews across Google, Yelp, Facebook, and TripAdvisor. The most opinionated city according to the data is Chicago, who had the most reviewed restaurants out of all the cities in the world. New York took the second spot, followed by San Francisco, Las Vegas, New Orleans, Washington D.C., Los Angeles, San Diego, Nashville, and Houston came in at 10.
Just short of the top 10—but still plenty opinionated—were Portland, Austin, Miami, Charleston, Atlanta, Detroit, the Twin Cities, Philadelphia, Dallas, and Boston.
So, which cities had the least number of reviewed restaurants? The city with the least reviewed restaurants was, surprisingly, London, followed by Paris, Denver, Seattle, and Montreal.
Lunchtime Preferences
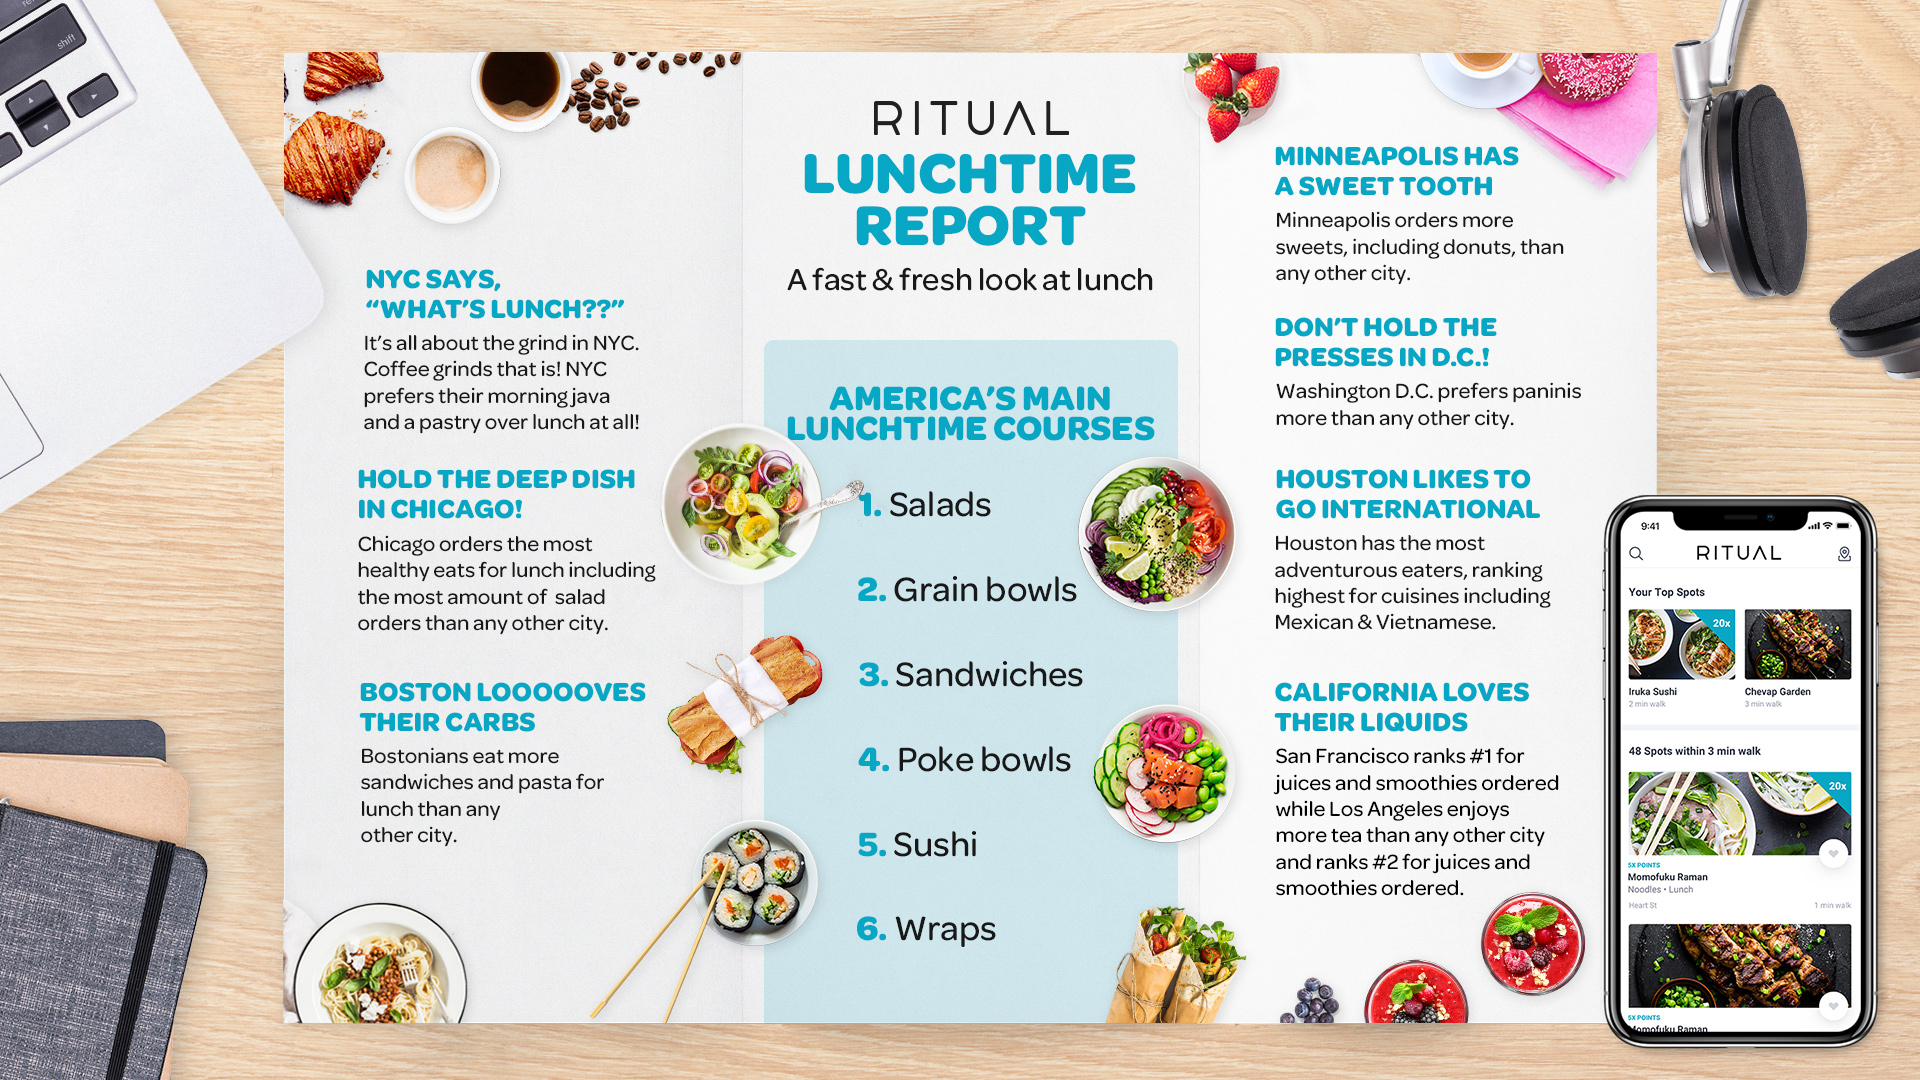
Ritual has also released new data which found that American workers have varying food preferences at lunchtime nationwide.

Boston: Carbs, Carbs, Carbs! Bostonians are eating the most pasta, bagels & sandwiches for lunch
Chicago: Salad > Everything. Chicago has the healthiest lunch habits
San Franciso: SF turns to juices, smoothies and occasionally, Poke
Los Angeles: Indian food and tea are the top choices for LAX
New York City: NYC skips lunch. A morning coffee & pastry does the trick
Minneapolis: Has a sweet tooth, eating more donuts during lunch than any other region
Houston: Runs the gamut. Houston residents are the most adventurous (and least health conscious) lunch’ers
Coffee Ordering Trends
ezCater analyzed the past year of coffee ordering data across its network of 60,000 restaurants and caterers in the U.S. to see what cities are spending the most on coffee at work. Here are their findings:
- Californians Order the Most Coffee at Work. San Bernardino, Calif. ranked #1 in 5 out of the 8 categories evaluated. San Francisco and San Jose also ranked within the “top 5” of 4 and 5 categories, respectively.
- Keeping Up With the Caffeination: At work, coffee is not just ordered for breakfast. In fact, businesses spend 16 percent more when they order coffee for lunch than they do when ordering for breakfast.
- In the Office, Seattle May Not Be America’s Coffee Capital. When ordering coffee at work, Seattle spends 6 percent less than the national average. In fact, Seattle spends less than the national average in 6 of the 8 categories analyzed.
- The ‘Seattle Freeze’ is Real When it Comes to Their Coffee. The one category where Seattle bucked this trend is iced coffee. When ordering iced coffee, Seattle business spend 157 percent more than average – but that still ranks Seattle third in iced coffee spend behind San Bernardino, Calif. and Atlanta.
Top Five Cities Spending on Coffee
“San Bernardino businesses spend 58 percent more than the national average when they order coffee.”
|
|
City |
percent More than National Average |
|
1 |
San Bernardino, CA |
58 percent |
|
2 |
San Francisco, CA |
50 percent |
|
3 |
San Jose, CA |
42 percent |
|
4 |
Chicago |
21 percent |
|
5 |
Boston |
20 percent |
Top Five Cities Spending on Coffee at Breakfast
“San Bernardino businesses spend more than twice as much (108 percent) as the average business when they order coffee for breakfast.”
|
|
City |
percent More than National Average |
|
1 |
San Bernardino, CA |
108 percent |
|
2 |
Oakland, CA |
43 percent |
|
3 |
San Jose, CA |
33 percent |
|
4 |
San Diego |
28 percent |
|
5 |
Boston |
27 percent |
Top Five Cities Spending on Coffee at Lunch
“San Bernardino businesses spend 40 percent more than the average business when they order coffee for lunch.”
|
|
City |
percent More than National Average |
|
1 |
San Bernardino, CA |
40 percent |
|
2 |
San Francisco, CA |
36 percent |
|
3 |
San Jose, CA |
27 percent |
|
4 |
Chicago |
16 percent |
|
5 |
Atlanta |
14 percent |
Top Five Cities Spending on Hot Coffee
“San Bernardino businesses spend 58 percent more than the average business when they order hot coffee.”
|
|
City |
percent More than National Average |
|
1 |
San Bernardino, CA |
58 percent |
|
2 |
San Francisco, CA |
51 percent |
|
3 |
San Jose, CA |
43 percent |
|
4 |
Chicago |
21 percent |
|
5 |
Boston |
20 percent |
Top Five Cities Spending on Iced Coffee
“San Bernardino businesses spend nearly three times as much (270 percent) as the average business when they order iced coffee.”
|
|
City |
percent More than National Average |
|
1 |
San Bernardino, CA |
270 percent |
|
2 |
Atlanta |
168 percent |
|
3 |
Seattle |
157 percent |
|
4 |
San Jose, CA |
92 percent |
|
5 |
Charlotte, NC |
65 percent |
Top Five Cities Spending on Dark Roast Coffee
“Chicago businesses spend 32 percent more than the average business when they order dark roast coffee.”
|
|
City |
percent More than National Average |
|
1 |
Chicago |
32 percent |
|
2 |
San Francisco |
30 percent |
|
3 |
Newark, NJ |
11 percent |
|
4 |
Boston |
4 percent |
|
5 |
Tampa – St. Pete, FL |
4 percent |
Top Five Cities Spending on Medium Roast Coffee
“New York businesses spend 37 percent more than the average business when they order medium roast coffee.”
|
|
City |
percent More than National Average |
|
1 |
New York, NY |
37 percent |
|
2 |
Philadelphia |
16 percent |
|
3 |
Orange County, CA |
16 percent |
|
4 |
Atlanta, GA |
7 percent |
|
5 |
Seattle |
6 percent |
Top Five Cities Spending on Light Roast Coffee
“New York businesses spend 37 percent more than the average business when they order light roast coffee.”
|
|
City |
percent More than National Average |
|
1 |
Orange County, CA |
31 percent |
|
2 |
Atlanta, GA |
9 percent |
|
3 |
Baltimore, MD |
5 percent |
|
4 |
Washington, DC |
4 percent |
|
5 |
Chicago |
2 percent |
San Bernardino, CA
Businesses in San Bernardino love their coffee and top the charts in 5 out of 8 categories.
San Bernardino ranks #1 in:
o Total coffee orders – 58 percent more than the national average
o Coffee at breakfast – more than double (108 percent) the national average
o Coffee at lunch – 40 percent more than the national average
o Spending on hot coffee – 58 percent more than the national average
o Spending on iced coffee – nearly three times (270 percent) the national average
San Francisco, CA
Runner up in three categories (behind San Bernardino in all of them)
o #2 in total spending (50 percent)
o #2 in lunch (36 percent)
o #2 in hot (51 percent)
San Jose, CA
Broke the top 5 in four different categories (only city to rank in more categories was San Bernardino)
o #3 in total (42 percent)
o #3 in breakfast (33 percent)
o #3 in lunch (27 percent)
o #3 in hot (43 percent)
o #4 in iced (92 percent)
Seattle
Seattle doesn’t live up to its reputation when it comes to drinking coffee at work. The city’s businesses spend less than the national average in most categories:
o 6 percent below average in total spend
o 24 percent below average in breakfast spend
o 15 percent below average in lunch spend
o 6 percent below average in hot spend
o 10 percent below average in dark roast spend
o 6 percent below average in light roast spend
However, there are two categories where Seattle bucks the trend:
o 157 percent above average in iced coffee spend, ranking it #3
o 6 percent above average in medium roast spend, ranking it #5
Chicago
Chicago breaks the top 5 in 4 out of 8 categories analyzed.
o #1 in dark roast (32 percent)
o #4 in total orders (21 percent)
o #4 in lunch (16 percent)
o #4 in hot (21 percent)
Boston
Boston breaks the “top 5” in 4 out of 8 categories
o #5 in total (20 percent)
o #5 in breakfast (27 percent)
o #5 in hot (20 percent)
o #4 in dark (4 percent)
Gas Station Coffee Ranked
GasBuddy reveals which gas station brands have the highest-rated coffee in each state, making them the best bet when you need a caffeine fix.According to NPD Group Inc, traffic growth to large coffee chains is slowing and traffic to small coffee chains and independent shops is declining. Consumers are noticing the growing number of other options available to them, including gas station convenience stores.
In 2017, hot dispensed beverages were the second largest category in convenience store foodservice at 14 percent of sales. The quality of coffee at gas stations have improved as well. Of the stations in the U.S that have ever received a coffee review in the GasBuddy app, more than 75 percent received positive reviews. Additionally, coffee was voted the “favorite food and beverage item in the gas station” according to a recent GasBuddy survey.
“Gas station convenience brands are investing heavily in their hot beverage programs, with retailers like 7-Eleven and Wawa adding permanent specialty coffee offerings at their locations,” said Frank Beard, convenience store and retail trends analyst at GasBuddy. “Over the years, gas station c-stores have increased their coffee quality to a level where they now compete with coffee shops. Their offer is also more affordable, drawing in tens of millions of consumers a day.”
As for the gas station brand that has the best coffee, GasBuddy data scientists reviewed more than 3 million coffee ratings covering more than 150,000 retail locations where gasoline is sold and found that Buc-ee’s captured the highest ratings in the nation as being the best gas station c-store for a cup of joe. On the state level, Tulsa, Okla.-based QuikTrip captured the top spot in seven states, while Media, Penn.-based Wawa, and Framingham, Mass.-based Cumberland Farms tied for second, both with six states.
The top five states with the highest-rated gas station coffee are Texas, Pennsylvania, Oregon, Wisconsin, and Florida.
Best Coffee Brankds by State
Alabama: MAPCO
Alaska: Holiday
Arizona: QuikTrip
Arkansas: Casey’s
California: 7-Eleven
Colorado: Kum & Go
Connecticut: Cumberland Farms
DC: Exxon
Delaware: Wawa
Florida: Wawa
Georgia: QuikTrip
Hawaii: Texaco
Idaho: Maverik
Illinois: Kelley’s Market
Indiana: Pilot
Iowa: Kwik Trip
Kansas: QuikTrip
Kentucky: Pilot
Louisiana: RaceTrac
Maine: Irving
Maryland: Wawa
Massachusetts: Cumberland Farms
Michigan: Holiday
Minnesota: Kwik Trip
Mississippi: Circle K
Missouri: QuikTrip
Montana: Holiday
Nebraska: Kum & Go
Nevada: Maverik
New Hampshire: Cumberland Farms
New Jersey: Wawa
New Mexico: Chevron
New York: Cumberland Farms
North Carolina: QuikTrip
North Dakota: Casey’s
Ohio: Sheetz
Oklahoma: QuikTrip
Oregon: Sinclair
Pennsylvania: Wawa
Rhode Island: Cumberland Farms
South Carolina: QuikTrip
South Dakota: Shell
Tennessee: Weigel’s
Texas: Buc-ee’s
Utah: Maverik
Vermont: Cumberland Farms
Virginia: Wawa
Washington: Mobil
West Virginia: Sheetz
Wisconsin: Kwik Trip
Wyoming: Maverik
Ready-to-Drink Coffee Trends
Consumers are looking for options beyond their typical cup of joe in favor of ready-to-drink (RTD) varieties offering functional benefits. When asked what their ideal bottled/canned cold coffee drink would include, new research from Mintel reveals that US RTD coffee consumers want options that include antioxidants (47 percent), promote brain health (40 percent), are anti-inflammatory (35 percent) or have added probiotics (30 percent).
Aside from functional benefits, there is also potential for coffee that encourages consumption beyond the usual morning or afternoon pick-me-up. More than two in five (42 percent) RTD coffee consumers say their ideal bottled/canned cold coffee drink would help them relax, while over one third (35 percent) are interested in products with added protein.
Innovation in the RTD coffee segment has contributed to its strong growth. In fact, while roasted coffee is the largest segment of the coffee category (39.2 percent market share), RTD coffee continues to drive the category as the fastest growing segment, growing 31 percent in the last two years. Overall, total coffee retail sales in the US are estimated to grow 4 percent in 2018 to reach $14.4 billion, with steady growth expected to continue through 2023.
“Innovation is vibrant and diverse in the RTD coffee segment and includes new products that are carving out sometimes surprising territory and often taking inspiration from unconventional beverage categories. What’s more, our research shows that iGeneration* consumers are more likely to drink RTD coffee than brewed coffee, indicating this is how they are entering the market. Consumer interest in better-for-you beverages is also shaping the market as demand for organic and non-GMO coffee or functional formulations enhanced with all-natural flavors, protein and vitamins grows. The broader trend of beverage blurring is also opening up opportunity for innovation and brand extension, especially in the RTD segment,” said Caleb Bryant, Senior Beverage Analyst at Mintel.
Non-dairy milk makes a splash
The better-for-you beverage movement extends to consumers’ coffee preferences both at-home and away. As non-dairy milk sales continue to rise, consumers are increasingly looking for it in their coffee, too: more than one third (36 percent) of RTD coffee consumers say their ideal RTD coffee would contain non-dairy milk. What’s more,Mintel research shows that just as many dairy milk consumers add dairy milk to their coffee/tea as non-dairy milk consumers add non-dairy milk to their coffee/tea (32 percent respectively). Dairy alternatives are making a splash on-premise, as well. According to Mintel Menu Insights, the use of non-dairy milk as an ingredient in coffee drinks on US menus grew 107 percent in the last two years**, with almond milk as the standout star, growing 198 percent in the same time period.
“Non-dairy milk is a fast-growing segment of the non-alcoholic beverage market, with many consumers, especially iGens and Millennials***, switching from using dairy milk to non-dairy milk on an everyday basis and as an addition to their coffee. While soy milk is the most common non-dairy milk used in both coffee and tea drinks, it is falling out of favor. Meanwhile, almond milk has experienced strong growth on menus across the US, indicating that we can expect to see operators swap soy milk for other non-dairy milks, with oat milk emerging as another rising star to watch,” continued Bryant.
Generation X drives third wave coffee movement
Innovation within the on-premise coffee market is spurring increased consumption among consumers as Mintel research reveals that one quarter (25 percent) of those who drink coffee away from home (AFH) say they are buying coffee drinks AFH more often in 2018 compared to a year ago. Those who are ordering coffee AFH more often are not only trying out new drinks (39 percent), but are also buying more premium and cold coffee beverages (32 percent respectively).
While younger consumers are driving consumption of cold coffee drinks, with 28 percent of iGens who drink coffee AFH saying that they most often order flavored iced coffee, Generation X consumers**** are driving the third wave coffee movement. In fact, Generation X consumers who drink AFH are the most likely generation to say they enjoy treating themselves to expensive coffee (38 percent vs 33 percent overall) and that they would be motivated to visit a new coffee shop for premium coffee beans (31 percent vs 21 percent overall)—staples of third wave coffee.
“The third wave coffee movement demonstrates that a sizable population of coffee drinkers view coffee as something that should be celebrated. Gen Xers, while a smaller segment of the US population compared to Baby Boomers***** and Millennials, are a prime target for shops offering third wave drinks as they are most likely to treat themselves to drinks made with premium coffee beans. Further, the growing presence of third wave coffee drinks means younger iGens will likely enter the third wave coffee market at a relatively young age. While iGens love flavored and iced coffee drinks now, operators must follow this generation throughout their ‘coffee career’ as many will ‘age out of’ these drinks and eventually join their older counterparts in the third wave coffee movement,” concluded Bryant.
Most Popular Coffee Chains
Global location data solutions provider Blis tracked unique foot traffic patterns at Dunkin’ Donuts and Starbucks stores locations across the country over a four week period. Here’s what it found:
Dunkin’ Donuts is America’s most popular coffee chain. The 68-year-old brand has a higher number of unique visitors, especially on Tuesday mornings when the traffic reaches its peak. Interestingly enough, Mondays have the least foot traffic for both chains, with a drop of almost 400K in-store visitors compared to Tuesday. One would think that a busy Monday morning would be ideal for a latte, but the data shows otherwise. Blis also took a look at a sample of a sample of 34 ads, which showed Dunkin’ Donuts advertised food options 14 times to Starbucks’ zero. For coffee ads, Starbucks had a whopping 29 ads, while Dunkin’ only had 11. Starbucks is clearly much more comfortable with being a morning destination as opposed to Dunkin’s “all day long” strategy, which may be another reason behind it's lagging sales.
That being said, Starbucks owns breakfast time. 28 percent more people visit Starbucks in the morning compared to Dunkin’ Donuts, even though the gap does start to narrow by lunch time. This should be no surprise as most of Starbucks advertising promotes coffee drinking, typically a morning activity for most. Starbucks recently expanded its “Happy Hour” promotions from just Frappuccinos to several other beverages, but that doesn’t seem to be helping foot traffic during the 3pm-6pm promotional window, as the majority of Starbucks’ foot traffic reaches an all time high in the morning and trickles down by this point. Dunkin’ Donuts' strong showing during this 3-6pm window could be attributed to the emphasis on day-long food offers and rewards. Dunkin’ is much more keen on pushing food options, which also helps narrow the foot traffic gap from 28 percent to 8 percent between the two chains by dinner time (5-8pm).
Dunkin got more uniques per location than Starbucks over the course of the four-week test period.
Day Performance
Tues most foot traffic in Dunkin
Fri most foot traffic in Starbucks
Mon has least foot traffic in both Starbucks and Dunkin
Time Performance
For breakfast/morning hours more people are going to Starbucks
28 percent more people in Starbucks vs Dunkin
For lunch Dunkin narrows the gap; still slightly more for Starbucks but to a lesser degree than for breakfast
14 percent less people in Dunkin vs Starbucks
Dunkin closes the foot traffic gap throughout the day
By dinner they are only 8 percent behind in foot traffic
Both chains do most of their business in the morning.
Ads
Out of a random sample of 34 ads:
Starbucks
Coffee- 29 ads
Food- 0
Rewards- 5
Dunkin
Coffee- 11 ads
Food- 14
Rewards- 9
Starbucks clearly pushing you come here for coffee vs Dunkin pushing come here any time of day.
Best Coffee Roasters
RAVE Reviews, the innovative site that publishes entertaining rankings based on advanced data-driven analysis, has published its ranking of the "Best Coffee Roasters." Deciding which coffee to buy these days can be a little tricky. An overabundance of choices and little knowledge of the industry lead many down the path of "I don't know, just pick one." Wrong answer! Comparing different beans for quality, taste, and strength is well worth the time and effort. It could mean the difference between crushing that morning presentation, or yawning your way to lunch. That's why we did it, just for you. You're welcome!
The methodology for the ranking included an analysis of consumer reviews, input from local coffee connoisseurs, and strict product testing guidelines. We tried to eliminate as many variables as possible while conducting the reviews such as coffee and water amounts, grind consistency, brew time etc.
"Most of us have a sense of the wide variety in flavors and quality of wine, but a lot of us don't pay any attention to – or even know about – the variety that you can find in coffee," said Hillary Miller, managing editor of RAVE Reviews. "With this ranking, our goal was to create something that was valuable both to people who know a lot about coffee and are looking for some new options, and to people who are totally new to the idea of high-quality coffee."
The Best Coffee Roasters ranking names 20 products. The title of the Best Coffee Roasters cannot be awarded for this ranking due to uncontrolled variables in testing and variations in personal preference.
The full list of winners includes:
Counter Culture, Durham, NC
Slightly Coffee Roasters, Eugene, OR
Heart, Portland, OR
Onyx Coffee Lab, Fayetteville, AR
Barista Parlor, Nashville, TN
Color Coffee Roasters, Eagle, CO
49th Parallel, Vancouver, WA
George Howell, Acton, MA
Ruby, Nelsonville, WI
Intelligentsia, Chicago, IL
Blue Copper, Salt Lake City, UT
Olympia, Olympia, WA
Sweet Bloom, Lakewood, CO
Joe, New York, NY
Cat and Cloud, Santa Cruz, CA
Klatch, Rancho Cucamonga, CA
Coava, Portland, OR
Verve, Santa Cruz, CA
Ritual, San Francisco, CA
Camber, Bellingham, WA
Best Coffee Cities
WalletHub released its report on 2018's Best Coffee Cities in America. To determine the best local coffee scenes in America, WalletHub compared the 100 largest cities across 14 key indicators of a strong coffee culture. The data set ranges from coffee shops, coffee houses and cafés per capita to average price per pack of coffee.
|
Top 20 Cities for Coffee Lovers |
||||
|
1 |
New York, NY |
|
11 |
Denver, CO |
|
2 |
Seattle, WA |
|
12 |
Las Vegas, NV |
|
3 |
San Francisco, CA |
|
13 |
Minneapolis, MN |
|
4 |
Portland, OR |
|
14 |
Philadelphia, PA |
|
5 |
Los Angeles, CA |
|
15 |
Orlando, FL |
|
6 |
Washington, DC |
|
16 |
Atlanta, GA |
|
7 |
Chicago, IL |
|
17 |
Austin, TX |
|
8 |
Miami, FL |
|
18 |
Pittsburgh, PA |
|
9 |
Boston, MA |
|
19 |
Oakland, CA |
|
10 |
San Diego, CA |
|
20 |
Fremont, CA |
Best vs. Worst
Tulsa, Oklahoma has the lowest average price for a pack of coffee, $3.38, which is 2.4 times lower than in Honolulu, the city with the highest at $8.16.
Fremont, California, has the highest average annual spending on coffee per household, $186.85, which is three times higher than in Cleveland, the city with the lowest at $63.06.
Gilbert, Arizona, has the highest share of households that own a single-cup/pod-brewing coffee maker, 24.50 percent, which is 2.7 times higher than in Hialeah, Florida, the city with the lowest at 8.99 percent.
New York has the most coffee shops, coffee houses and cafés (per square root of population), 1.1791, which is 17.4 times more than in Laredo, Texas, the city with the fewest at 0.0678.
Portland, Oregon, has the most coffee and tea manufacturers (per square root of population), 0.0209, which is 41.8 times more than in Riverside and San Bernardino, California, the cities with the fewest at 0.0005.
Bakery and Coffee Trends
Both the bakery- and coffee cafe segments have opportunities to maintain their growth, though brands must adapt to shifts in consumer behavior. Technomic's 2018 Bakery & Coffee Cafe Consumer Trend Report reveals that health trends are pushing consumers toward better-for-you items at the center of cafe menus, such as soups and salads. But at the same time, these trends are pushing consumers away from sugary treats and drinks commonly associated with bakeries and cafes. Likewise, a shift toward more off-premise occasions can benefit cafes with a grab-and-go focus as well as those that offer delivery service.
"Despite some recent headwinds caused by increased competition and shifting consumer demands, bakery- and coffee cafes are still well-positioned for growth," explains Charles Winship, senior research analyst at Technomic. "However, cafes must be willing to evolve with a growing emphasis on functional offerings, new technology that enhances convenience and operational flexibility to satisfy consumers' various need states."
Key takeaways from the report include:
- 25 percent of consumers visit bakery-cafes at least once a week and 35 percent visit coffee cafes at least once a week
- 54 percent of bakery-cafe consumers visit these locations more so for their food or a specific food product, while 25 percent visit more so for their beverages or a particular beverage
- 44 percent of coffee cafe consumers say they are loyal to a specific cafe because it serves their preferred coffee
Breakfast Believers
The old adage that breakfast is the most important meal of the day still rings true for most people, according to Packaged Facts' report Breakfast: Retail Product Trends and Opportunities in the U.S., 2nd Edition,The "breakfast believer", as identified by Packaged Facts, represents those who subscribe to the notion that breakfast is more important than lunch or dinner. Leveraging this positive sentiment can help companies and brands when marketing new products as well as rationalizing premium-priced breakfast food products. Women, over 65s, blacks, and Hispanics emerge as likely subscribers to the breakfast-believer mentality. Not surprisingly, data show that breakfast believers are more likely than average to use all types of breakfast foods.
Since women embrace the breakfast daypart, it's likely that, as moms, many will continue to pass down the belief that breakfast is the most important meal of the day. This helps explain why families are particularly important breakfast users. In 2018, the child population is 74 million strong, accounting for 22 percent of the total U.S. population. With little change in the number of children expected through 2020, industry players must engage kids earlier and retain relationships through the teen years to realize full market potential. The most effective marketers will leverage honed strategies to increase the connection with the core family market without alienating the childless household.
Older consumers also remain steadfast in their allegiance toward breakfast. The challenge is that the U.S. population is aging. By 2020, the 56.5 million adults aged 65+ will represent 16.9 percent of the population. This means that industry players will need to be mindful of the older consumers' breakfast habits and preferences to ensure market stability. Additionally, industry players may need to work harder to adapt to the preferences of younger consumers for the best opportunity for market growth.
Race/ethnicity also emerges as a distinguishing characteristic in breakfast usage and habits, with blacks and Hispanics championing the importance of breakfast. With an increasingly diverse population, it's prudent for breakfast marketers to understand that the importance of targeting households across the cultural spectrum. The multicultural consumer requires marketers leverage strategies in order to appeal to respective traditional and cultural values, such as advertising in Spanish to better communicate with Hispanics.
As with any food and beverage market, health and wellness trends are an ever-present influence. Healthy breakfast innovation is prevalent in the grocery aisle, with overnight oats, simple ingredient nutrition bars, and functional yogurts exemplifying the influence. While low calorie and low carb were at one time benchmarks for health food, attention has shifted to a greater focus on low/no sugar or low/no added sugars. Sugar is an ingredient in many packaged breakfast foods, especially cereal and breakfast pastries. While health trends are evident in foodservice too, it can be difficult to discern the importance of health to consumers when they dine out—necessitating breakfast menus feature items that play to indulgence and health independently. Industry players are doing their part in addressing health trends through new product development of better-for-you breakfast, but there's clearly room for more players to find a seat at this table.
CPK Pizza Survey
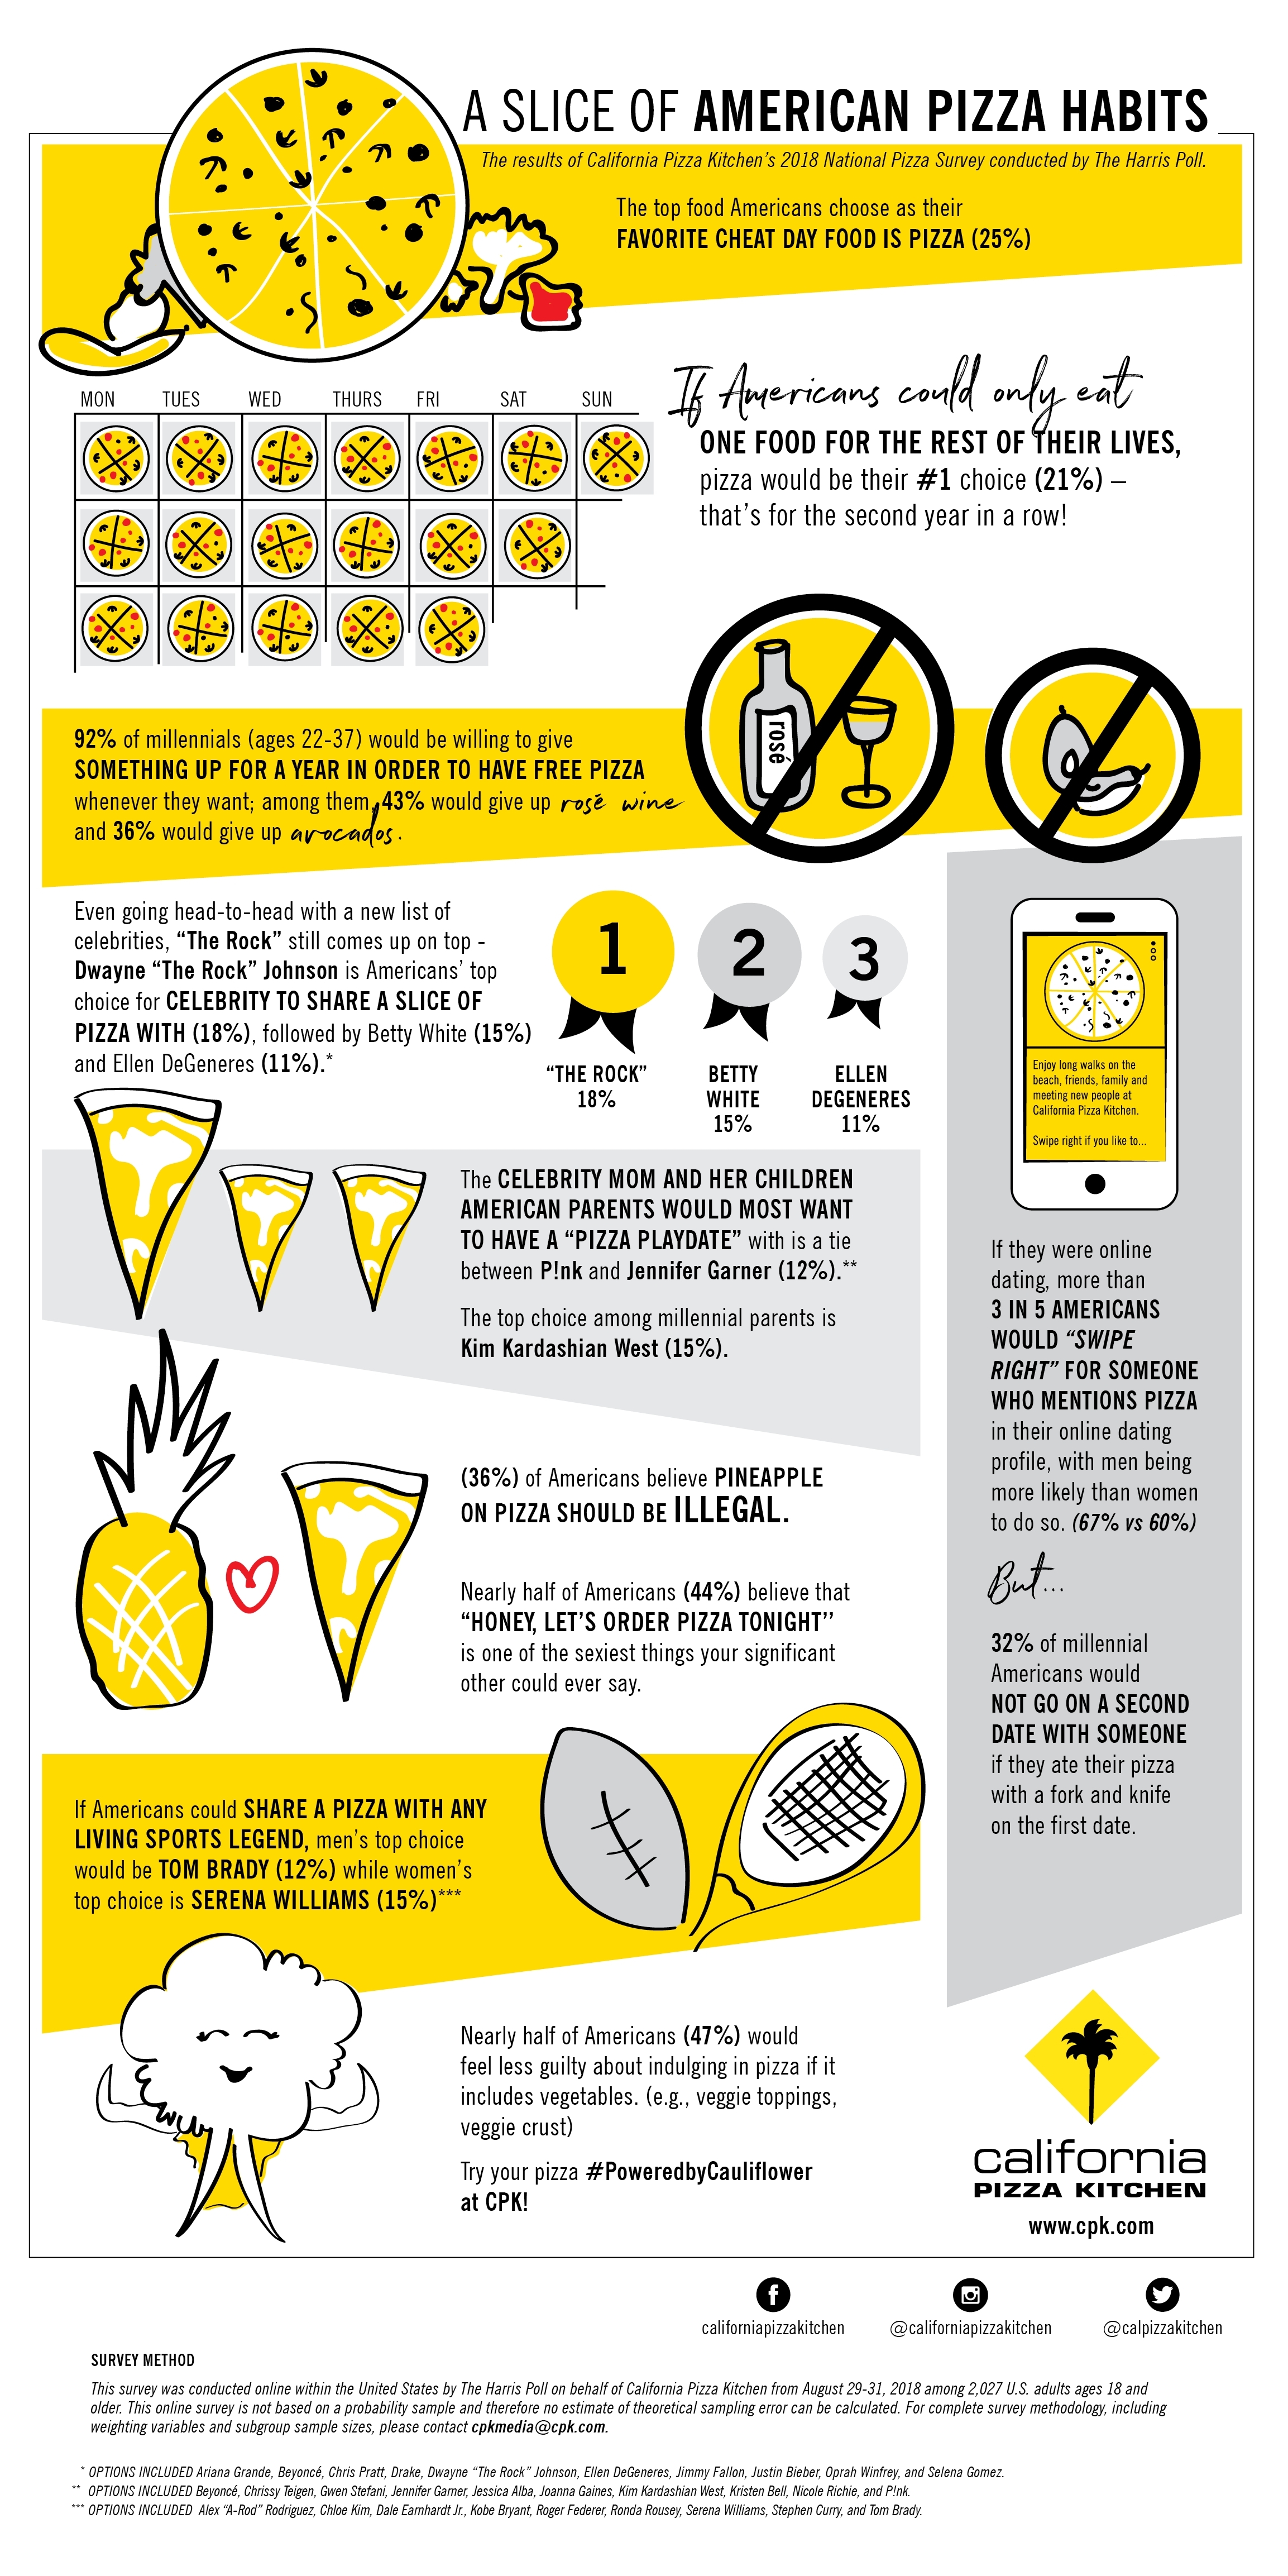
The top food Americans choose if they could only eat one food for the rest of their lives is pizza – for a second year in a row! The second annual nationwide survey conducted by The Harris Poll®* on behalf of California Pizza Kitchen (CPK) celebrates National Pizza Month this October by revealing a whole new set of fun facts all about pizza. This year’s survey, conducted online among 2,027 U.S. adults ages 18 and older, touches on everything from guilty pleasures to celebrity favorites to dating.
California Pizza Kitchen’s 2018 Pizza Survey highlights include:
Pizza reigns supreme: If Americans could only eat one food for the rest of their lives, pizza would be their top choice (21 percent).
The best day of the week: The top food Americans choose as their favorite cheat day food is pizza (25 percent).
Say goodbye to rosé, reality TV, and avocados?!: Nearly 9 in 10 Americans (86 percent) would be willing to give something up for a year in order to have free pizza whenever they want; among them, nearly half (45 percent) would be willing to sacrifice reality TV; 92 percent of millennials (ages 22-37) would be willing to give something up for a year in order to have free pizza whenever they want; among them, 43 percent would give up rosé wine and 36 percent would give up avocados.
Going head-to-head with a new list of celebrities, “The Rock” still comes up on top: Dwayne “The Rock” Johnson is Americans’ top choice for the celebrity they would most want to share a slice of pizza with (18 percent), followed by Betty White (15 percent) and Ellen DeGeneres (11 percent); among millennials, Dwayne “The Rock” Johnson is also the preferred pizza partner (21 percent), followed by Chris Pratt (13 percent) and Ellen DeGeneres (12 percent).**
Parents’ preferred pizza playdate pick: Overall, the celebrity mom and her children American parents would most want to have a “pizza playdate” with is a tie between P!nk (12 percent) and Jennifer Garner (12 percent); the top choice of millennial parents? Kim Kardashian West (15 percent)!***
Guys want to share a slice with the QB king while the gals choose the tennis queen herself: If Americans could share a pizza with any living sports legend, men’s top choice would be Tom Brady (12 percent), while women’s top choice is Serena Williams (15 percent). Among millennials overall, the top choice of living sports legend to share a pizza with is Serena Williams (14 percent).****
MUST love pizza: If they were online dating, more than 3 in 5 Americans (63 percent) would be likely to “swipe right” for someone who mentions pizza in their online dating profile, with men being more likely than women to do so (67 percent vs. 60 percent).
Think again before picking up your fork and knife: 22 percent of Americans would not go on a second date with someone if they ate their pizza with a fork and knife on the first date; 32 percent of millennials agree.
Ooh-la-la!: Nearly half of Americans (44 percent) believe that “Honey, let’s order pizza tonight’’ is one of the sexiest things your significant other could ever say; 60 percent of millennials agree.
It’s official – pineapple is IN!: Only 36 percent of Americans believe pineapple on pizza should be illegal.
“As the results of our second annual pizza survey show, pizza is a passion for many in a variety of ways – that is why National Pizza Month is something we look forward to celebrating each and every year,” said Jim Hyatt, CEO of CPK. “This year, we have an array of plans to honor everyone’s favorite food. From lighthearted and fun pizza stats, to a creative new pizza invented by our Pizza Chef of the Year, to our biggest sweepstakes yet, this National Pizza Month will offer something for everyone to enjoy.”
What Beers Sell
Beers with a 7 percent ABV(alcohol by volume), 55-66 IBU (International Bitterness Units) will on average outsell everything else by 70 percent at last call. This is according to data collected from SteadyServ. This data came from analyzing detailed real time sales and consumption data collected and managed by the company across several major markets in the U.S.
What does this mean? For bar and restaurant owners, this information can be very impactful to their bottom line. Instead of relying on a specific vendor or distributor for information, this service takes the guesswork out trying to figure out what their customers like. By utilizing SteadyServ’s technology, managers can now know exactly what is selling and why, as well as, always have the perfect beer line up that closely aligns with customer demand at that point in time.
“It’s revolutionized how much and what kind of beverages we order and make. We are making customers happier, and they’re coming back. That’s every restaurateur’s goal” said Brian Graham, President & Owner of Four Day Ray Brewing.
SteadyServ data is completely distributor-neutral, providing highly accurate personalized data for each and every establishment, giving real-time access to what’s selling best and when, as well as, what to promote and when to promote it so that beverage sales go up and patrons come back. It allows companies to look at their best selling beverages at any time period – weekends, weekdays, holidays, happy hours, summer break and more. It also allows establishments to save costs on wasted beer.
“The use of data, artificial intelligence and mobile technology is changing the performance dynamics of virtually every industry, especially retail and the suppliers who support them. Restaurants, bars and beer are no exception to this. If you know more, you sell more. Leveraging actionable intelligence and decision making software tools are no longer a luxury, they are a requirement if you wish to succeed.” said Steve Hershberger, CEO of SteadyServ.
The Transparency Imperative
A new report released today from Label Insight and Food Marketing Institute (FMI) revealed that grocery shoppers exhibit loyalty to those products that create deeper relationships through information exchange. The Transparency Imperative report found that shoppers increasingly demand transparency and a closer connection to their food, so much so that 75 percent are more likely to switch to a brand that provides more in-depth product information, beyond what's provided on the physical label. When shoppers were asked the same question in 2016 in a similar study by Label Insight, just 39 percent agreed they would switch brands.
FMI, with support from Label Insight, developed this report with the goal of defining what transparency means to shoppers and how it impacts their food retail purchases. The Transparency Imperative further delves into attitudes and behaviors among health-conscious shoppers, those who are digitally engaged, and reveals how consumers respond across generations. Recognizing these consumer audiences, the report recommends the necessary steps brands should consider to further embrace transparency; relay information beyond just ingredients; understand the specific needs of key shopper groups; meet the increased expectations of online shoppers; and track changing consumer preferences as this trend progresses.
In the report, 86 percent of shoppers agreed that if food manufacturers or retailers provided access to complete and easy to understand definitions for all the ingredients, it would result in more trust. Nearly as many shoppers (80 percent) said that they are more likely to be loyal to a brand that provides more in-depth information, beyond what is provided on the physical label. More than half of shoppers (54 percent) are even willing to pay more for a product that has additional product information.
"The new shopper mindset requires brand owners to think about their products well beyond the traditional label and respect a more digitally-minded consumer," FMI Vice President, Industry Relations, Doug Baker noted. "The study offers several considerations for how to make the best use of these findings, but overall, they require companies to recognize and communicate the importance of transparency and perform a thorough review of their unique consumer audiences and commerce channels."
What is Transparency?
The vast majority of consumers (69 percent) say it is extremely important or important that brands and manufacturers provide detailed information such as what is in their food and how it is made. Interestingly, online shoppers (80 percent), college graduates (76 percent) and higher grocery spenders – $125+/week (75 percent) – were more likely to agree with this sentiment.
When asked to further define what elements define transparency, older generations (Baby Boomers and Generation X) are more likely than Millennials to focus on a complete list of ingredients, ingredients descriptions, and nutritional Information. Millennials also focus on these indicators, but they are more likely than older generations to look at allergen information, certifications and claims, explanations of ingredient usage information, and other details such as animal welfare, fair trade and labor practices.
"We titled this report The Transparency Imperative because as we executed the research to bring the key findings of our 2016 studies current, we see clearly that transparency is only becoming more important to consumers," said Patrick Moorhead, Chief Marketing Officer for Label Insight. "Their attitudes and preferences, particularly with the growth of e-commerce, make it clear that transparency is critical to growth and our industry must take action."
Meet the Health-Conscious Shopper
Nearly half (47 percent) of American households have someone on a diet or following a health-related program. These shoppers are even more likely to place a premium on transparency – 61 percent will pay more for products that offer in-depth product information, versus 54 percent of general shoppers. When a label is not sufficient, these shoppers (89 percent) are very likely to seek out information elsewhere. Nearly half of this segment (47 percent) would be very likely to use a smartphone in-store to find additional information beyond what's available on the label and the shelf.
The study also found that the presence of children in the home increased the desire for transparency. Shoppers with children are more likely to place greater importance on ingredient information, nutrition and health benefits. They were also particularly likely to find value in accessing detailed product information in-store on their smartphone (87 percent) and to use this method (85 percent).
Grocery E-commerce Increases Transparency Expectations
The study found that 26 percent of shoppers purchased groceries online in the last 30 days. Yet this group represents a valuable demographic – they are more educated, have higher household incomes and more likely to have children under the age of 18. While Millennials are disproportionately shopping online, they only make up 39 percent of online shoppers. Generation X (30 percent) and Baby Boomers (23 percent) also represent a significant portion.
Online grocery shoppers expect more product information (76 percent) when shopping online than if they were in a physical store; and 72 percent believe that getting product information is even more important when shopping online. Additionally, 81 percent are willing to switch to a brand that provides more in-depth product information, compared to 75 percent of general shoppers.
Halal Shopper Study
Nourish Food Marketing, Canada's only full-service marketing agency working exclusively with food, beverage, and agricultural clients, has just completed its fifth annual halal shopper study. The study, which surveyed over 1,000 principal grocery shoppers, has significant implications for food manufacturers, retailers, and restaurants. The Halal market continues to be an underserved yet fast-growing population. Recent Statistics Canada data estimates Canada's Muslim population to be 1.4 million and projects the Muslim population will exceed the size of the Chinese ethnic market by 2021. (As projected by Stats Canada via alternative religious mobility.)
But, despite being a diverse, thriving, and growing community, the study found that the majority of halal consumers continue to feel underserved: 57 percent of respondents do not believe grocery food chains are doing a good job meeting their needs; 62 percent feel the same way about major food companies. These ratings have remained at about the same level for the past 5 years.
"While we know that both retailers and food companies are doing a better job meeting the halal shoppers' needs, we are also seeing the halal consumers' expectations rise," says Salima Jivraj, head of Nourish Multicultural and founder of Halal Foodie and the Halal Food Festival.
The study also provides insight to guide marketing strategies, highlight gaps in the marketplace, assess the strength of halal certification bodies and halal brands, and shows how best to connect with the halal market segment.
Another perhaps surprising finding was that the majority of halal shoppers seldom or never use ethnic media. "Ethnic media may not be as relevant a spend as it was in a pre-digital age," says Jivraj.
"All companies should be rethinking their overall multicultural spend, as most are underspending against the halal consumer. As our population continues to become more diverse, companies should always be applying a multicultural lens to their programs," says Jo-Ann McArthur, President of Nourish Food Marketing. "It's just smart business."
Due to Canada's immigration policy, this is a very well educated consumer group with strong earning and spending potential. "Where other market categories see a growth of 1-2 percent, the Halal market is growing between 10-15 percent annually," adds McArthur. "Companies can no longer afford to miss this consumer."
All About OmniLocal
Mitchell Communications released a report that offers new insights to marketers on how consumers are redefining local brand engagement. The goal was to better understand how purchasing habits in the digital age are shaping the future of local marketing. “The OmniLocal Consumer Report” shows that any brand, including large national brands, can be local, and local can be anywhere in the minds of Gen Z and Millennial consumers.
OmniLocal consumers increasingly define “community” by shared interests and mindset instead of geography or proximity. At the core of the OmniLocal consumer is the fundamentally distinct way they perceive the concepts of “community” and “local.”
Key findings include:
- 74 percent of Gen Z and Millennial consumers do not define “community” by specific geographic location.
- 55 percent of these consumers define community by shared interests and mindset, without regard to shared geography.
- 51 percent of OmniLocal consumers find that digitally connecting with people of shared interests makes them feel that “local can be anywhere.”
“As an agency that has been a leader in hyperlocal PR for more than 20 years, we wanted to take a fresh look at local through the eyes of consumers,” said Sarah Clark, CEO of Mitchell. “The data indicates that the brands that are going to win in this new age of OmniLocal marketing are the ones that understand how to be local at all times – whether a consumer engages that brand online with their phone or in a store, whether they are buying from the boutique down the street or the website on their mobile device.”
Building on Mitchell’s extensive experience in connecting brands and consumers at the local level, the agency conducted an in-depth analysis of younger consumers – Gen Z and Millennials. Findings demonstrate that audiences want the expansive access and connections that only digital can deliver, as well as the geographically-driven local experiences defined by what they can see, hear, taste or touch. The data showed that consumers are increasingly seeking an OmniLocal brand experience that blends the digital with the geographic.
Additional findings include:
Local Knowledge Matters: 63 percent of respondents agree that brands demonstrating local knowledge of their community are appealing.
Local Brand Interest Matters: By more than 2 to 1, respondents agreed that a blogger/influencer who shares their interest for a local brand is a local influencer even if they do not live in their community.
Local News Matters: The top three most trusted sources of local news for OmniLocal consumers are local newspapers (mobile/digital), local newspapers (print) and local TV news.
Retail Radio Lift
TagStation LLC, owner of the Dial Report® radio measurement platform, said findings from its new brand study that show radio ads, on average, drive 22 percent traffic lift for retailers.
The study analyzed 1.5 million radio spot plays for 10 brands in the top 100 US markets, collecting listener data from April through June 2018. Utilizing the Dial Report’s proprietary radio attribution capabilities, researchers compared consumer actions of listeners exposed to radio campaigns against those not exposed to ultimately evaluate the impact of radio advertising on average retail store visits.
“We are excited to share these study findings that further confirm how important broadcast radio is to the entire retail industry,” said Paul Brenner, President of TagStation, LLC. “Dial Report’s unique attribution capabilities can help broadcasters better enable advertisers, to analyze specific consumer behaviors, like foot traffic, in order to identify trends and optimize campaigns.”
Key findings of the study include:
Store traffic lift saw the following increases:
Automotive: 32 percent
Beauty: 32 percent
Quick Service Restaurants: 23 percent
Home Improvement: 7 percent
Retailers saw higher average store visits from listeners exposed to radio ads on Saturdays and Wednesdays compared to those not exposed
Retailers saw higher average store visits from listeners exposed to radio ads on Top 40 and Adult Hits radio formats compared to listeners not exposed
“We’re delighted to partner with TagStation’s Dial Report team to once again demonstrate radio’s effectiveness to influence consumer decisions and purchase behavior,” said Erica Farber, President and CEO of the Radio Advertising Bureau (RAB). "Continued conclusive attribution and critical data provides broadcasters, advertisers and brands greater clarity on assessing ROI for radio campaigns.”
Location Effect on Shopping Habits
Uberall, Inc. announced the results of a survey evaluating how location factors into the way people shop. For the study, Uberall commissioned a survey of more than 1,000 smartphone users across the U.S. Nearly 70 percent say cost is main reason for brick-and-mortar store selection.
When asked what typically makes the respondents shop at one brick-and-mortar location over another, 68 percent cited cost as the top factor. The runner up was proximity, which 55 percent of people chose as the reason for picking a store. Rounding out the top-5 responses were product selection (53 percent), online customer reviews or ratings (36 percent) and brand loyalty (34 percent).
“Today’s shoppers value cost and convenience when deciding to shop in-store,” said Josha Benner, Co-Founder of Uberall, Inc. “Surprisingly, brand loyalty has taken a backseat. Most consumers will only visit a brick-and-mortar location if the store is nearby.”
A recent Uberall survey found that more than 80 percent of people are conducting “near me” mobile searches. When asked how likely the respondents were to use a store finder on a retailer or brand’s website, 42 percent said they were “very likely.” Other responses included “somewhat likely” (39 percent), “somewhat unlikely” (9 percent), “not sure” (5 percent) and “very unlikely” (4 percent).
“When planning a shopping trip to physical stores, shoppers often want to know what location is closest to them for convenience, but they also want more information about what products or services each location has to offer and at what cost,” added Benner, “One of the easiest ways to figure that out is by visiting a store’s website. Store locator pages answer a lot more questions than just a listing. Too many retailers are assuming search engines will do this work for them. But that’s not enough. Many consumers are still going to brand websites for local store and shopping information.”
Social Media Impact
Digital commerce consulting firm SUMO Heavy released its 2018 Social Commerce Revisited report which explores the impact of social media on consumer behavior and how emerging social features like messaging chatbots can better serve brands and retailers. The study polled consumers across the country and aims to identify how people interact with different social channels and technology during their online shopping journey.
The survey revisits questions posed in SUMO Heavy's 2016 Social Commerce Survey and compares the results to the realities of social commerce behavior and adoption in 2018. While overall social media use remains high among consumers, concerns related to security, privacy, and legitimacy plague social commerce, a method of shopping directly through a social media platform like Instagram's "Shoppable Tags."
Interactions with messaging chatbots remain low in number, but they have been received positively by consumers. Familiarity with conversational commerce, or shopping through chatbots on messaging apps remains low, though use was expected to increase.
The survey, conducted in May 2018, includes responses from 1,046 U.S. consumers ages 18 and over. 53 percent of respondents identify as women and 47 percent identify as men. According to the survey:
Social media's influence is on the rise. 58 percent of respondents said social media influences their purchasing decisions today, compared to 45 percent in 2016.
Social commerce transactions have stalled. Despite the recent hype around social commerce, 82 percent of consumers have yet to transact using social buy buttons or other forms of social commerce.
Consumer awareness is high but so are concerns. 80 percent of shoppers are familiar with social commerce, but security and privacy concerns keep them from transacting.
Chatbots are gaining favor as a trusted resource. 72 percent of people who have used chatbots find them to be helpful and informative. Better yet, 74 percent of shoppers are now open to making a purchase through a chatbot, compared to 55 percent in 2016.
"It's no surprise that social media use is as high as ever. Checking and updating these platforms has become a daily routine for the average consumer," says Bart Mroz, Co-founder and CEO of SUMO Heavy. "But ethical concerns regarding privacy and user data have made consumers skeptical when it comes to making transactions via social channels or chatbots. The niche audience of consumers who have had positive experiences, however, signals a future increase in adoption as they become more aware of the benefits of social media shopping and conversational commerce."
Data from the new survey suggests that brands and retailers must continue to leverage social media channels in new ways to market and sell to their customers. While most shoppers have yet to transact directly through these channels, businesses should look to invest in the future of social media shopping and emerging social technology as overall consumer sentiment evolves from neutral to positive in the coming years.
Digital Marketing Forecast
Almost half of businesses invest at least $500,000 in digital marketing every year, according to a new survey from The Manifest, a business news and how-to website.
Forty-one percent (41 percent) of businesses spend at least $500,000 on digital marketing annually, and 81 percent spend at least $50,000.
Investment in digital marketing is likely to increase every year, experts say.
“There’s been a significant uptick in digital marketing spend because it’s where consumers are,” said Flynn Zaiger, CEO of Online Optimism, a digital marketing agency in New Orleans. “If you’re trying to be in front of your customers, the screen is the place to be.”
Ninety-Nine Percent of Businesses Will Increase Digital Marketing Spending by Mid-2019
Almost every business plans to invest more time and money in digital marketing.
Among businesses that use digital marketing, nearly all (99 percent) plan to increase their investment in at least one channel in the next year.
Businesses place considerable value in digital marketing and want to invest more in it because customers spend much of their time online.
“Everyone is online, all the time, and digital marketing is crucial in reaching this huge audience where they are,” said Aylin Cook, head of content marketing at digital marketing agency Single Grain.
Businesses Will Spend More on Social Media and Websites
Most businesses plan to increase their investment in a combination of digital marketing channels, with social media (64 percent) and websites (55 percent) topping the list.
Experts say both channels are easy investments for businesses and deliver clear returns.
“[Social media marketing and websites are] the strategies that business owners are most comfortable with,” Zaiger said. “If you’re trying to make a decision that will at least guarantee some sort of results, chucking money at social media or your web designer will make something happen.”
Businesses want to invest more in social media and a website because they are easy investments with measurable results.
One-Third of Businesses Plan to Outsource Digital Marketing
Among businesses that rely solely on in-house staff and software for digital marketing, nearly one-third (32 percent) plan to outsource their digital marketing within the next year.
Outsourcing digital marketing can help a business receive essential external perspective, experts say.
“[Companies] should be getting an outside perspective because sometimes extra minds can be a really big bolt to someone’s system,” Zaiger said.
Overall, the survey indicates that businesses across all industries value digital marketing and will continue to spend more on it every year.
The Manifest’s 2018 Digital Marketing Survey included 501 digital marketers from U.S. companies with more than 100 employees.
Halloween Spending
Once again, Americans are looking forward to splurging on their favorite candy, costumes and decorations during the Halloween season. According to the National Retail Federation’s annual survey conducted by Prosper Insights & Analytics, total spending for Halloween is expected to reach $9 billion, the second highest in the survey’s 14-year history. The figure is relatively the same as last year’s previous record of $9.1 billion.
Celebrants are planning to spend an average of $86.79, up from last year’s $86.13, with more than 175 million Americans planning to partake in Halloween festivities this year.
“The economy is good and consumer confidence is high, so families are ready to spend on Halloween this year,” NRF President and CEO Matthew Shay said. “Retailers are stocking up to supply children, pets and adults with their favorite decorations, candy and costumes for the season.”
According to the survey, consumers plan to spend $3.2 billion on costumes (purchased by 68 percent of Halloween shoppers), $2.7 billion on decorations (74 percent), $2.6 billion on candy (95 percent) and $400 million on greeting cards (35 percent).
Among Halloween celebrants, 70 percent plan to hand out candy, 50 percent will decorate their home or yard, 48 percent will wear costumes, 45 percent will carve a pumpkin, 32 percent will throw or attend a party, 30 percent will take their children trick-or-treating, 21 percent will visit a haunted house and 18 percent will dress pets in costumes.
Pet costumes continue to gain popularity, with nearly 20 percent of celebrants planning to dress their pets in costumes this year up from last year’s 16 percent.
“One of the biggest trends this year is the growth of spending on pet costumes,” Prosper Insights Executive Vice President of Strategy Phil Rist said. “Out of the 31.3 million Americans planning to dress their pets in costumes, millennials (25-34) are most likely to dress up their pets, the highest we have seen in the history of our surveys.”
When looking for inspiration for the perfect costume, 35 percent of consumers will look online, 29 percent will look in stores, 19 percent will ask friends and family, 19 percent will look to Pinterest and 16 percent will look to Facebook; 16 percent will be influenced by pop culture and 15 percent by YouTube.
For buying costumes and other Halloween supplies, 45 percent of shoppers will visit discount stores and 35 percent will go to a specialty Halloween store or costume store. In addition, 25 percent will visit department stores, 24 percent will buy online and 24 percent in grocery/supermarket stores.
Avocado Market Forecast
The global avocado market is anticipated in a report by Transparency Market Research (TMR) to find players setting up new facilities in different locations to boost their distribution efforts. For instance, Henry Avocado Corp. had cut the ribbons on a new distribution center on the Eastern U.S. Coast in June 2018. Moreover, it is expected to open another facility in the West Coast in the near future, according to company president, Phil Henry. The TMR report identifies key players of the global avocado market, viz. McDaniel Fruit Co., Fresh Del Monte Produce Inc., and The Horton Fruit Company.
TMR envisages the global avocado market to clock a 5.9 percent CAGR between 2018 and 2026 to obtain a valuation of US$21.56 bn by the final forecast year. In 2016, the global avocado market was valued at a US$13.64 bn. Among end-use industries, retail is expected to take the lead in the global avocado market. This segment was worth a US$7.82 bn in 2017. Regionally, the global avocado market could witness the rise of Latin America dominating on the basis of both revenue and volume. Along with North America, Latin America currently holds a 60.0 percent collective share of the global avocado market.
Millennials to Improve Awareness about Avocado Benefits for Healthy Living
The demand in the global avocado market is foreseen to see a rise as a result of the high requirement of healthy food among a vast population of health-conscious people. The global avocado market could receive a strong push in its growth due to increasing popularity of the products among millennials and the younger generation largely focusing on healthy living. High reputation of avocado as one of the healthiest foods is expected to create massive demand in the global market. Moreover, high nutritional content of products offered in the global avocado market could increase sales and benefit manufacturers in terms of revenue growth.
Risk of Reduced Milk Production in Breastfeeding Mothers to Hamper Consumption
The global avocado market is projected to attract lucrative growth opportunities in the coming years. However, rising awareness about the side effects of using products offered in the global avocado market could stunt the growth of players during the course of the forecast period. Furthermore, the risk of decreased milk production in new mothers or pregnant women is expected to discourage the intake of avocado. Even people with hypersensitivity are advised to not to consume avocado. Overconsumption of avocado can lead to reduced cholesterol level, cause allergy, and affect the liver.
Nonetheless, with appropriate amount of avocado consumed, none of these risks could affect the human body. In fact, there are several benefits associated with the right consumption of avocado. This is foretold to work in the favor of the global avocado market.
Global Craft Beer Market
High-end, small batch and expertly-crafted beer, or ‘craft beer’ as it is more commonly known, has shot to global prominence in the span of just a few years as a primarily US trend. While craft has been around for years in Europe, the continent is now taking a global leadership role in craft beer innovation, according to new research from Mintel.
According to Mintel Global New Products Database (GNPD), only five years ago (2013) North America (and the US especially) dominated the global craft beer industry, accounting for 52 percent of all craft beer retail launches* compared to just 29 percent for Europe. Since then, the story has flipped. In 2017, 54 percent of launches originated in Europe, and just 19 percent in North America. Since 2013, Europe’s craft beer scene has experienced huge growth with new craft beer product launches more than doubling, experiencing growth of 178 percent. While the US is still the single most innovative market globally, with 17 percent of all global craft beer launches originating there in 2017, six of the top ten most innovative markets are in Europe**.
Jonny Forsyth, Associate Director, Mintel Food & Drink, said: “Over the last few years, interest in craft beer has migrated from the US into the UK and now into continental Europe. Our research suggests that Europeans are embracing craft beer because they are looking for new, more exciting offerings compared to their usual beer options, especially in markets such as Germany, where brewers and beer styles have remained unchanged for centuries. While markets like Germany, Belgium and Czech Republic are still dominated by their own beer styles when it comes to innovation, consumer interest in craft beers is already there and offers ample opportunities for manufacturers.”
Indeed, beer drinkers in Poland (64 percent), France (63 percent), Italy (61 percent) and Germany (50 percent) are all interested in trying different types of craft beer, such as Indian Pale Ales or other pale ales, which are already common place in the more mature UK craft beer market. Europeans are also willing to spend more on craft beer. Around half of beer consumers in Italy (52 percent), France (51 percent), Germany (46 percent) and the UK (45 percent) agree that craft beer ‘is worth the extra money’.
“Craft is the ‘new premium’ in beer, and consumers are happy to pay more for smaller-batch, more hand-crafted options, rather than those that are mass-produced. For these consumers, craft beer taps into their desire for new experiences with a nod to the past for inspiration, offering new beer styles that they have never drunk before.” Forsyth continues.
However, Mintel research reveals that European consumers do not care too much about the difference between a ‘true craft’ beer (i.e. small, independent) or a ‘craft-like’ brand owned by big global brewers. Nearly half of Spanish beer drinkers (45 percent) say it’s not clear what makes a beer craft and less than a fifth (17 percent) of German beer consumers say it would impact their purchase decision if a craft brand was owned by a large company. This points towards an uphill challenge for true craft manufacturers. But there is reason for optimism as over two in five (44 percent) beer drinkers in the UK would like to see a system of certification of craft beer.
“The term ‘craft’ lacks a formal definition which has enabled larger beer companies to capitalise on the craft boom, either by launching their own craft-style products or acquiring craft breweries, challenging what ‘craft’ really means for this industry. This practice of big brewers swallowing up profitable, smaller craft operators shows no signs of slowing down. An industry-wide definition could be both helpful to smaller manufacturers and welcomed by European consumers, as many beer drinkers want greater clarity and assistance in navigating the category.” Forsyth concluded.
Global Scotch Sales
Global sales of Scotch whisky ended four years of decline with a slight increase in 2017, and the category is poised for a bright future thanks to a blends resurgence, according to new research.
The Global Scotch Whisky Insights report from just-drinks and The IWSR, which is published today, highlights a 1 percent rebound in total sales of Scotch last year, reaching just under 93m nine-litre cases in the process. However, 2017 was another mixed year for the category, with leading markets France and the US both declining, and sales falls in nine out of its top 20 markets.
Scotch owed its improving fortunes to a welcome recovery in a number of emerging markets, including Russia, Brazil, Poland and China – the first growth seen in the latter market for six years.
The joint-report says it expects these trends to continue in the next five years, with France and the US set to decline further, while the prognosis is much more positive in emerging markets, especially in Brazil, Mexico, Russia, India and Poland.
Although still dwarfed by blends, single malts will continue to expand ahead of the wider category, enjoying all but ubiquitous growth.
For malts, the issue continues to be managing supply and demand while waiting for stocks to build. Meanwhile, blends face an ongoing challenge in mature markets to engage with younger consumers in particular.
Clean Confusion
Some terms associated with clean labels are defined and regulated by the U.S. government, albeit not always to the satisfaction of consumers or advocacy groups, reports market research firm Packaged Facts in the 2018 study, Organic and Clean Label Food Consumer in the U.S.
Other terms, most notably "natural," are widely used but essentially meaningless, and attributes like "minimally processed" are more conceptual than quantifiable. The dearth of standardized, consistently-applied language can be a significant obstacle in the marketing of clean label foods, which are expected to embody the principles of authenticity, integrity, and trust. On the other hand, the connection with clean label for consumers is often a visceral, "I'll know it when I see it" one.
As adherents to a movement whose language ranges from grand, nebulous concepts (sustainability, integrity, authenticity) to ill-defined buzzwords (minimally processed, natural), without benefit of a marketing lexicon or regulatory infrastructure to help them make informed choices, clean label consumers can be left confused, uncertain, and skeptical, notes David Sprinkle, research director for Packaged Facts.
Unfortunately, U.S. government regulations don't necessarily make consumers feel more secure about food safety or other clean label issues. For instance, Packaged Facts surveys show that fewer than half of adults believe animal welfare standards are being upheld. Many aren't convinced that animals raised for food are treated appropriately under current practices and regulations, or are skeptical of the validity of marketing terms like "cage free" or "free range."
Particularly in a deregulatory political environment, organic and clean label consumers will increasingly demand clarity and transparency from food producers, manufacturers, retailers, and foodservice operators.
Food Container Market Forecast
The global Food Container Market is anticipated to rise at a staggering CAGR in the forthcoming period. Food containers come in several size and shape. The plastic, as a raw material used for packaging of food items, differs in purpose. For instance, PET plastics used for medicine jars, beverage bottles absorbs the odor and food flavors stored within them. As compared to PET, HDPE bottles finds its use especially for milk storage.
The underlying assumption role for food packaging involves protection of food products from outer influences and external damage to the food. Another major purpose in using a food container is to empower customer's access to ingredient and nutritional information. Overall, the holistic goal of food packaging is to preserve the food in a cost-effective way without disturbing the nutrition level and fulfilling consumer desires.
The market witnessed heavy influences in the past due to rise in large supermarkets owing to increase in purchase of processed food. Rise in migration from rural to urban areas and increase in disposable income positively affected the market growth. Other factors such as maturation of market, convenience of packaging, flexible size and greater consumption of packaged food products contributed to the market growth.
Food container industry, at present, is driven by significant increase in customer base across the globe, rise in number of women workforce and increasing demand for convenient food packaging across the globe. Change in lifestyle and rising innovation to produce convenience food products in emerging economies pumps the market growth.
Rising importance of flexible packaging in the nutrition industry revealing excellent properties such as flavor retention, heat insulation and moisture resistance is anticipated to drive the market growth in the forecast period. Product segmentation for food container market includes paperboard, rigid packaging, flexible packaging, metal and glass. Flexible packaging accounts for higher growth in the forecast period due to preferred mode of packaging and consumer demand.
Application segment for food container industry includes grain mill products, bakery, fruits & vegetables and meat processed products. Meat processed products are likely to gain a significant growth in the global market due to increase in demand for meat and meat products.
Geographical segmentation for food container market includes North America, Latin America, Europe, Asia-Pacific, Middle East and Africa. North America food container industry holds a significant market share in the forecast period due to rise in demand for convenient food owing to presence of a vast workforce.
Asia-Pacific's market is anticipated to rise at a higher market position due to presence of a food chain and eateries engaged in food packaging. Middle East and African markets witness a positive traction owing to the rise in consumer base and increased tourism in these regions. The key players in the food container market include Ball Corporation, Silgan, Berry Plastics, Caraustar Industries, Klockner Pentaplast Group, Bemis and Graham Packaging.