
According to a Recent Study/Survey … Mid-July 2017 Edition
47 Min Read By MRM Staff
This Mid-July edition of Modern Restaurant Management (MRM) magazine's "According to a recent study/survey …" research round-up features fast food preferences, the status of independent restaurants, most-likely restaurant tippers, ice cream popularity, corks and the great debate over paper towels and air dryers.
Fast Food Fans
There is no denying that Americans love fast food. Whether you are looking for the perfect kid’s meal from McDonald’s, a chicken biscuit from Chick-Fil-A or a foot-long sandwich from Subway, fast food is unquestionably a staple of the American diet. Cambridge Analytica, a data analytics firm with a database of demographic, consumer, lifestyle and psychographic data on more than 220 million Americans, surveyed fast food enthusiasts about which chains they frequent, which they would recommend to friends and why they enjoy going.
Highlights include:
- 72 percent of people have visited McDonald’s in the past six months
- Subway is second at 55 percent and Chick-fil-A is tied at third with Burger King (44 percent)
- Millennials tend to eat out much more especially at fast food restaurants
- When eating at a fast food restaurant, their expectations are based on good value for a cheap price, variety, new items and having a good time with friends
- The rich have visited fast food restaurants less frequently than the rest
- Low income earners do not visit Chick-fil-A as much
- Chick-fil-A is the most recommended fast food restaurant
- The most regarded features at Chick-fil-A are atmosphere, quality of food and friendly staff
Women have higher expectations
-
Women have higher standards when choosing restaurants, where a healthy menu has the highest gap of 11 percent uplift in score.
-
Food taste is of most important for everyone
-
This is followed by atmosphere, location, quality
-
Most people do not care about a fast food being liked by their social environment (although see Millennials, below)
Example: When choosing a fast food restaurant, on a scale of 1 (not at all important) to 5 (extremely important) the average female diner rates food taste as 4.6, where the male 4.4.
-
Women are 12 percent more likely to have visited Chick-fil-A,
-
and men 19 percent more likely to have visited Burger King
-
Millennials tend to eat out much more (only 39 asked)
-
Young people (18-34) have visited Chick-fil-A in the last six months much more than the rest of the population, 55 percent compared to 42 percent of 35 and older (a 29 percent uplift).
Example: When asked the last time they ate at Chick-fill-A 46 percent of females claimed to have visited in the past 6 months, compared to 41 percent of males.
By Income
-
The rich visited fast food restaurants less frequently than the rest.*
-
Low income earners do not visit Chick-fil-A as much (37 percent compared to the overall 44 percent)
*Note that the population was selected under the condition that they have been to at least one fast food restaurant in last half month.
Example: When asked the last time they at at Chick-fill-A 37 percent of low income earners claimed to have visited in the past 6 months, compared to 48 percent of medium earners.
By Location
-
In the past six months, people from the Top 10 populated cities ate out at fast food restaurants the least*
-
Middle America have recently visited White Castle more than the rest of the nation (21 percent vs. 11 percent, a 90 percent uplift)
-
Middle America have recently visited Arby’s more than the rest of the nation (41 percent vs. 30 percent, a 35 percent uplift)
*Note that the population was selected under the condition that they have been to at least one fast food restaurant in last half month.
Example: When asked the last time they at at White Castle 21 percent of Middle claimed to have visited in the past 6 months, compared to 5 percent of the rest (Non Middle America)
Millennials want to be excited (but make it cheap!)
Their expectations are similar to the rest of the fast food population
But do prefer more than the rest:
-
Good value for less
-
Have a variety
-
New items
-
Have a good time with friends
Example: When choosing a fast food restaurant, on a scale of 1 (not at all important) to 5 (extremely important) the average millennial diner rates the importance of it liked by friend-family-coworker as 3.5 where the average person rates 2.7.
Highest regarded:
-
● Chick-fil-A is the most recommended fast food restaurant, head and shoulders above the rest (70 percent more likely than the second in rank, Subway, which is at 40 percent).
-
● Chick-fil-A is the third most frequented (see in by Location slide)
-
● McDonald’s, The most frequented restaurant, is also the second least regarded after Burger King.
Example: 74 percent of females are likely to recommend Chick-fil-A to a friend/colleague, where 60 percent of males are likely to.
Most enjoyed features at Chick-fil-A:
-
Atmosphere
-
Quality of food
-
Reasonably priced
-
Considered healthy
-
Friendly staff
-
Fast Service
Chick-fil-A could improve with more convenient locations
Example: When describing their experience at Chick-fil-A people rate highly the good clean atmosphere with an average score of 4.5 (of 1-5*) , where for McDonald’s gets a score of 3.6.
Restaurant Sales and Traffic Post Best Quarter Since Q2 2016; Staffing Woes Increase
It’s a “good news, bad news” update for restaurant industry performance this month. Bad news is same-store sales and traffic growth were still negative in June and the second quarter of 2017; and year-over-year, same-store sales have been declining for the last six consecutive quarters. However, the good news is that June results were the best for the industry for both sales and traffic growth since January, and the second quarter of 2017 posted the best results since the second quarter of 2016. These insights come from TDn2K™ data through The Restaurant Industry Snapshot™, based on weekly sales from 28,500+ restaurant units, 155+ brands and represent $67+ billion dollars in annual revenue.
“This is likely the result of a combination of factors,” commented Victor Fernandez, Executive Director of Insights and Knowledge for TDn2K. “While economic indicators have been pointing to some improved conditions this year, the reality is that we are also lapping over some weak results in 2016 which make the comparisons much easier for the industry in 2017.”
Same-store sales growth was -1.0 percent in June and growth for the second quarter of 2017 was also -1.0 percent. As a comparison, same-store sales growth for the first quarter was -1.6 percent. Same-store traffic fell by -3.0 percent during June. Traffic declined by -3.1 percent for the latest quarter, a significant 0.6 percentage point improvement from first quarter results.
Average guest checks grew at the same rate in the second quarter as in the first. Both periods posted year over year increases of 2.2 percent. In general, check averages have been growing more slowly since 2015. In that year, average checks were up 2.8 percent. The more modest increases are a factor in the continued softness in top-line results.
“Brands seem to be reluctant to implement significant price increases given the current environment. Price promotions have been widely utilized, especially by struggling brands and segments to drive traffic,” said Fernandez. “Average guest checks for the ‘bar and grill’ sub-segment of casual dining remain flat year over year for the first two quarters of 2017, while casual dining overall has seen its guest checks grow by only 1.2 percent.”
Economic and Job Growth Accelerate
“Both job and economic growth picked up in the spring, though neither can be classified as robust,” according to Joel Naroff, president of Naroff Economic Advisors and TDn2K economist. “The surprisingly large June employment increase was largely due to outsized public sector hiring, which should unwind in the next few months.”
“Consumption, meanwhile, has slowed and vehicle sales have faltered. That is good news for other retail sectors, including restaurants, as credit growth is moderating. The rise in debt payments has funneled money from spending on other goods and services. National retail sales data seem to be indicating the outflow from restaurants is ending, but an uptick in demand has yet to appear.”
“Nevertheless, the summer season should be solid as people have money to spend. Unfortunately, until wage gains improve, which so far continue to be disappointing, no major acceleration in spending at restaurants should be expected,” predicted Naroff.
Fine Dining & Upscale Casual: Best Performance Results
Affluent restaurant consumers continue to respond positively to those brands that provide a more experience-driven dining occasion. Fine dining was the best performing segment based on same-store sales growth in the second quarter, followed by upscale casual. These were the only two segments with positive sales. They were also the top performing segments in the first quarter.
However, even those segments with positive growth in their same-store sales are doing so through increases in average guest checks and not through driving incremental guest visits. All segments experienced a fall in their guest counts year over year during the quarter. The increased competition for dining occasions both from within the industry (independent operators) and from other sectors (grab-and-go prepared food options, meal replacement kits, and other players like convenience stores and food trucks) continue to grab additional share from traditional chain restaurants.
The weakest segments based on second quarter results were fast casual and the ‘bar and grill’ sub-segment within casual dining.
Quick service, which was the top-performing segment in 2016 and was among the top three segments in 2015, is now struggling to keep up building on that rapid growth. The segment has now experienced three consecutive quarters of negative same-store sales growth.
Increase in Turnover and Staffing Headaches
Restaurant sales may be showing modest signs of improvement, but when it comes to finding enough qualified employees to staff the restaurants and retaining them once they are hired, the industry is still facing an uphill battle. According to TDn2K’s People Report™, rolling-12-month restaurant hourly employee turnover increased again in May. Turnover for restaurant managers is also on the rise and is tracking at a 10-year high.
Recent research by People Report shows that staffing challenges are greater for the back-of-the-house (BOH) hourly employee positions compared with their front-of-the-house counterparts. Companies have expressed that turnover rates tend to be higher for their BOH positions. Additionally, these positions tend to take longer to fill and generate fewer job applicants than their front of house openings.
The unemployment rate continues to drop and brands report that the majority of applicants are coming from competing restaurants. The result is pressure on restaurant wages, which are expected to increase in the upcoming quarters. Almost 75 percent of restaurant companies report that they are offering higher wages as an incentive for potential employees.
Also a case of good news, bad news: the restaurant industry continues to create jobs. The latest numbers for the chain restaurant industry show year-over-year growth in net number of jobs at 1.0 percent in May, after 1.9 percent growth reported for April. This reflects an industry that continues expanding and opening locations, but it also adds to the headaches of those in charge of staffing those restaurants.
“The real story is not average performance,” cautioned Wallace Doolin, Chairman and Co-Founder of TDn2K. “The sales growth performance gap from the top quartile and the bottom quartile of table service brands has grown to 8.4 percent in the second quarter of 2017. The gap for counter service brands has risen to 10.9 percent. And at the trade area, DMA or country level, we see a widening gap of performance that is driven by more than just the marketing budget and remodels. At every level we see retention of talent, adequate staffing and engaged employees predicting top or bottom quartile performance.”
Are Independent Restaurants Growing in the U.S.?
In the first quarter of 2017 consumer visits to major chain restaurants, which represent 64 percent of total industry traffic, were up one percent year over year compared to a 3 percent visit decline to independent restaurants, which represent 22 percent of all foodservice traffic, according to The NPD Group.
There has been a lot of buzz about the strength of independent restaurants, even to the point of some saying independents were doing better than major chains. A clear understanding of restaurant performance begins with defining the landscape. In the first quarter of 2017 consumer visits to major chain restaurants, which represent 64 percent of total industry traffic, were up one percent over year ago compared to a 3 percent visit decline to independent restaurants, which represent 22 percent of all foodservice traffic. Consumer spending at major chains increased by 3 percent over year ago and spending was flat at independents, according to NPD.
The decline in customer visits to independents is largely a reflection of the fact that independent restaurant unit count dropped by four percent. A four percent decline in unit count but only a three percent decline in visits suggests that there are some of the 323,456 remaining independent restaurants in the U.S. succeeding. For example, independent operators doing well enough to order from broadline foodservice distributors increased their dollar spend by 2 percent and cases ordered from these distributors were up slightly in the first quarter compared to year ago, reports NPD.
There are also those independents successful enough to expand to three-19 units, which NPD classifies as micro-chains. Micro-chain counts, particularly in major metro areas, are increasing and this diverse segment of restaurants often reflects emerging trends in food and customer experience, which often enables success. Micro-chain case orders from broadline foodservice distributors grew by 3 percent in the first quarter compared to year ago.
“However you define ‘independent’ restaurants, the macro environment is not generating demand growth,” said David Portalatin, NPD’s vice president, industry analysis and author of Eating Patterns in America. “But even in this challenging environment there are many examples of major chains, micro-chains, and independents that are thriving because they have a differentiated experience, superior quality, and excellence in execution. These fundamentals are key to restaurant success at every segment of the industry and in any macro-economic environment.”
How America Tips
A new CreditCards.com survey offers a rare look at who the big spenders really are when it comes to leaving gratuities for the wait staff at sit-down restaurants. Topping the list of best tippers:
- Men
- Republicans
- Northeasterners
- Baby boomers
- Anyone who tips with a credit or debit card
Those groups all leave a median tip of 20 percent of the total bill when they dine out, making them the best tippers among diners at U.S. restaurants. Women, by contrast, leave a median tip of 16 percent, and the median for Southerners and Democrats is 15 percent.
The scientific telephone poll of 1,002 adults conducted June 22-25, 2017, found that overall, 4 out of 5 Americans say they always give a restaurant tip, and the median tip is 18 percent. It also found that credit and debit card users were significantly more likely to tip than diners tipping with cash. See survey methodology.

University experts who study tipping, and waiters interviewed by CreditCards.com, say the results ring true. Michael Lynn, a Cornell University professor who studies gratuity practices, says many factors influence tipping habits. But in general, he says, the wealthier you are, the more you tend to plunk down at the end of the night. That observation is reflected in the survey, which shows those making $75,000 or more per year are indeed the most frequent and generous tippers.
Who we do, don’t tip
The poll also looked at how often Americans tip other types of service providers:
- When getting a haircut, 67 percent always tip the stylist or barber; 12 percent never do.
- In a coffee shop, 29 percent always tip the barista; 30 percent never do.
- When staying at a hotel, 27 percent always tip the housekeeping staff; 31 percent never do.
The gender gap
While men and women are equally likely to tip restaurant servers, men say they’re more generous, the survey shows. Fifty-nine percent of men say they leave a tip that exceeds 15 percent of the bill, versus just 47 percent of women.
A handful of servers interviewed by CreditCards.com say they, too, have noticed that men leave them more money.
“All of the really big tips I’ve gotten have been from men, and some of the really bad ones have been from groups of women,” says a server at an upscale restaurant in Henrico County, Virginia. “I think sometimes men tip more because they’re trying to impress someone.”
The results were a surprise to Lynn, the Cornell professor, who says other recent studies on tipping have shown no difference between men and women except in specific situations, such as when the waitress is attractive. Since the CreditCards.com survey is based on self-reported information (rather than actual tips left), Lynn says it is possible the men exaggerated how much they give.
The poll did find that women are better tippers in other situations. Women are significantly more likely than men to tip:
- Hair stylists or barbers: 79 percent of women tip them always or most of the time, compared to 74 percent of men.
- Baristas: 46 percent of women tip them always or most of the time, compared with 41 percent of men.
- Hotel housekeepers: 47 percent of women tip them always or most of the time, compared to just 33 percent of men.
Lynn speculates that women may feel more empathy toward hair stylists and hotel maids, since those jobs are typically held by women. Women may also have a better appreciation for how much work it takes to tidy up a hotel room.
Do whites really tip more?
The poll found that in the four potential tipping situations (restaurant servers, hair stylists, hotel housekeepers and baristas), whites were, on average, the most generous tippers, not only in the amount tipped but in the number who say they tip at all.
While 94 percent of whites say they tip their restaurant servers all or most of the time; 82 percent of Hispanics and 78 percent of blacks say the same. Whites were also twice as likely to say they typically leave a tip that exceeds 15 percent of the total bill.
The survey parallels other studies using different methodologies that have found that, on average, African-Americans tip less than whites. The gap can be partly explained by education and income differences, experts say.
But another factor is that many blacks and Hispanics are simply less familiar with the social expectation to tip 15 to 20 percent, says Richard Feinberg, a professor at Purdue University who has studied tipping. “A lot of tipping behavior is learned behavior; you learn from watching your parents, so if your parents don’t do it, how do you learn?” he says.
Lynn notes that when he conducted a study to test familiarity with tipping norms, two-thirds of blacks and only one-third of whites – didn’t know that the modern American norm is to tip between 15 to 20 percent in restaurants.
Regional differences
Geographically, people who live in the Northeast are most likely to open up their wallets for restaurant waiters, hotel housekeepers and hair stylists. But coffee shop baristas get the best treatment in the Midwest and West, where about half of all customers say they drop some cash in the jar always or most of the time.
Waiters and waitresses may want to avoid the South. It’s the only region where both the average and the median tip left for servers at sit-down restaurants is a sparse 15 percent. For comparison, the median in the West, Midwest and Northeast are 18, 20 and 20, respectively.
Southerners also are less likely to tip the people who do their hair. Seventeen percent never give their barber or hair stylist a gratuity, versus 11 percent of Midwesterners and 9 percent of those who live in the Northeast and West.
The Northeast dominates when it comes to the amount diners tend to tip in restaurants, with about 3 of every 5 (62 percent) leaving a tip that exceeds 15 percent of the bill. Next most generous is the Midwest (57 percent), followed by the West (51 percent) and the South (46 percent).
Much of the nation’s wealth is concentrated in the Northeast, so that likely explains some of the disparity, says Michael McCall, a professor at Michigan State University who specializes in consumer behavior.
In addition, because many Northeasters live in urban areas, “They likely have more tipping encounters than people in other parts of the country, so they quickly learn what’s expected,” McCall says. “Tipping behaviors are directly related to your knowledge of tipping customs and norms.”
Baby boomers tip for food service, not for hair
The survey shows that, in general, the older you are, the larger the tip you will leave in a restaurant. So young millennials (ages 18- 26) leave a median tip of 16 percent of the bill, Generation Xers report a median of 18 percent of the bill, and the number rises to 20 percent for baby boomers.
The exception is the silent generation (ages 72 and above), whose median tip is 15 percent. The drop could be related to the fact that money often gets tight for people of that age because medical expenses rise and they are on a fixed income, Lynn says. Or it may simply be because those seniors were raised during a time when the expected norm for tips was lower.
It’s not surprising that baby boomers lead the pack when it comes to how much they tip because they’re at their peak earning potential, Lynn says. In addition to wait staff tips, boomers are also most likely to tip coffee shop baristas, with 38 percent saying they always do. Only 31 percent of the silent generation and 25 percent of Generation X and millennials say the same.
Card tippers versus cash tippers
The survey also found that half of all Americans today are using a credit or debit card to tip their server in a restaurant, and they are leaving higher tips and tipping more often than those who pay in cash. Consider:
- About 9 in 10 of those who pay with plastic say they always tip the wait staff, compared to only 76 percent of those who plunk down cash.
- Sixty percent of those who pay with plastic say their tip usually exceeds 15 percent of the bill, versus 45 percent of cash payers.
- In fact, almost a third of those who pay in cash admit that they typically leave a tip of 10 percent or less.
| CARD USERS MORE LIKELY TO LEAVE A RESTAURANT TIP | ||||
|---|---|---|---|---|
| We asked a random sample of 1,002 people in the U.S. how they usually tip at sit-down restaurants: by cash, debit card or credit card. Then we asked how often they tip: always, most of the time, sometimes or never. Those paying by card are significantly more likely to tip. | ||||
| Tip by cash | Tip by debit card | Tip by credit card | Total | |
| Always tip | 76 percent | 88 percent | 91 percent | 79 percent |
| Tip most of the time | 14 percent | 6 percent | 5 percent | 9 percent |
| Tip sometimes | 10 percent | 6 percent | 4 percent | 7 percent |
| Never tip | N.A. | 2 percent | ||
The survey results are in line with other research that has found that people spend more when they pay with plastic than with actual cash, no matter what they’re buying. “When you pay with a card, your brain doesn’t see it as real money, so it’s not as painful,” says Michael McCall, a professor at Michigan State University who specializes in consumer behavior.
Americans who make more than $75,000 a year are the most likely to use a credit card to pay a gratuity, with about 2 of every 5 tipping that way. Younger folks, on the other hand, rely more on debit cards. The groups who tend to tip in cash are those who make under $30,000 a year, live in rural areas or are over age 72.
The survey found no statistically significant difference in the gratuity habits of debit versus credit card tippers.
What servers say
Restaurant servers contacted by CreditCards.com say the poll results are in line with their personal experiences. People who pay with credit cards seem to leave more, and they tip more consistently.
“In my experience, white men are the best tippers,” says Darron Cardosa, who has waited tables at a neighborhood restaurant in Sunnyside Queens, New York, for more than 20 years. “Of course, that is a generalization, but I think most folks who wait tables would agree.”
Who does the wait staff dread? Big groups of young people. “When I see a bunch of college-age people or people in their 20s, I hope it’s not my table, because I know they’re not going to tip well,” says an 18-year-old waitress at an upscale pizza place in Charlotte, North Carolina. “People who are middle-aged who pay with credit cards are the best tippers.”
Other survey findings
The poll data also revealed the following findings:
Income differences
- The wait staff can count on a tip from anyone earning $75,000 a year or more: 99 percent of these earners always or usually tip at restaurants. Tips are iffier when the diner earns less than $30,000 a year, but still, they always or usually tip 76 percent of the time.
- Anyone earning $50,000 or more is likely to leave a bigger tip when getting up from the table. Those at or above that income level have a median restaurant tip of 20 percent. Those making less than that leave a median tip of 15 percent.
Political party differences
- Republicans and independents are the big tippers. The poll found that 57 percent of independents and 59 percent of Republicans typically leave an average restaurant tip that exceeds 15 percent of the bill. Only 46 percent of Democrats could say the same.
- Republicans and independents are also more likely to tip hair stylists and coffee shop baristas compared to Democrats. All three tip hotel maids at about the same rate.
The best hair stylist tippers
- The older you are, the less likely you are to tip the person who does your hair. Those 50 and older say they never tip their barber or hair stylist twice as often as those ages 18-29 (15 to 7 percent).
- People who are married are the best hair stylist tippers, with 68 percent saying they always tip, in contrast to 57 percent of unmarried folks.
Why coffee shops are remarkable
- Coffee shops are one of the few places where the affluent are actually less likely to leave a tip than those with lower annual salaries. Fifty-five percent of those with an annual salary of $30,000 to $49,900 say they tip their baristas all or most of the time, compared to 49 percent of those with a salary between $50,000 and $74,900 and just 41 percent of those who make more than $75,000 a year.
- Coffee shop customers who don’t have children are significantly more likely to tip the barista. About 1 in 3 (32 percent) childless patrons always drop a few bucks in the jar, versus 1 in 4 who are parents.
How Yoga is Influencing One of the Hottest Culinary Trends
Meditate on this: Ancient wisdom for 21st century living is influencing not just exercise trends, but also food and beverage choices for some Americans, according to Cutting Edge Wellness: Culinary Trend Tracking Series. Thanks to the huge popularity and mainstream status of yoga, the ancient Indian healing practice of Ayurveda has become better known to American wellness consumers. Ayurveda is a complex holistic approach to restoring balance in a person that includes physical, mental, emotional and spiritual elements. People lose balance due to disease, aging, improper diet, stress and trauma. To restore it, Ayurvedic practitioners use food, beverage, herbal supplements, meditation and exercise as well as mindful eating habits.
Which Consumers are Embracing Ayurvedic Principles and Holistic Health
This notion of holistic well-being is appealing to wellness consumers who aspire to healthier living that includes restful sleep, balanced exercise and diet, traditional herbal supplements and meditation. For example, Packaged Facts found that for Boomers, Millennials and anyone else seeking holistic health approaches, Ayurvedic principles are intriguing and attractive, providing a historical context and reasons to believe.
"Ayurvedic food and beverages fit for consumers well-versed in physical fitness, supplement-supported wellness, and alternative medicine. For yogis and those meditating along with Dr. Deepak Chopra or Oprah, Ayurvedic ingredients may already be part of a personal regime," says David Sprinkleresearch director, Packaged Facts. "Paleos, Keto dieters and natural food lovers also find inspiration in some Ayurvedic items, such as ghee and supportive herbs.
However, a specific Ayurvedic diet is not likely to be an exclusive practice beyond those working with a healer for a specific treatment. Instead, as is typical in our try-it-on-for-size wellness society, a few star ingredients and food items have risen out of the tradition and taken on lives of their own. Take turmeric, for example, the recently anointed superspice gilding hot beverages in coffee shops across the country. Or—as Sprinkle mentioned—ghee, a rising good fat in the natural and specialty grocery channels. Behind these health-food darlings are more traditional Ayurvedic herbal and medicinal teas, as well as a host of novel ready-to-drink functional beverages, touting potent botanical benefits that appeal to consumers seeking tonics with a touch of tradition.
What's Next For Ayurveda Foods and Beverages
Brands committed to Ayurveda say so and find their audience in yoga adherents and others tapped into this wellness vein. For new product or brand development, being authentically part of a real Ayurvedic practice will be key if that positioning is desired. Alternatively, many wellness brands that are picking and choosing healing ingredients—pinch of ashwagandha here and a sprinkle of turmeric there—can still offer education, resources and supply chain reassurances on marketing materials and websites to ground a product's legitimate benefits.
On the culinary side, regional Indian cuisine flavors and forms connect diners to a deeper cultural context and offer great taste (especially in vegetarian fare), but as these ingredients become more familiar, they don't always have to be dressed up in that fashion. Instead, they can be part of a broader approach to wellness that intelligently draws from multiple traditions
Ultimately, Packaged Facts anticipates the biggest opportunities for such products lie in the functional health space, where tonics and elixirs offer refreshment with natural-feeling energy boosts and other benefits that are more subtle and long-term, like adaptogenic support.
Construction Update
Researched by Industrial Info Resources (Sugar Land, Texas–Food & Beverage Industry projects that are scheduled to start construction in the third quarter of 2017 across the U.S. are estimated to have a combined total investment value of more than $6 billion. Industrial Info has identified more than 600 capital and maintenance projects that are slated to being construction from July through September. Capital expenditures point to more than 530 projects with a combined value of $5.8 billion, while maintenance spending tallies up to $150 million from 114 projects. The projects range in investment value from $500,000 to $300 million.
Top Places to go for your Favorite Foods
Almost half (44 percent) of global travelers consider exploring global cuisines a hobby of theirs[iii], so digging into the local delicacies of a culinary capital of the world is a treat many travelers can't wait to enjoy. With over half of people (51 percent) admitting to indulging in a local delicacy within 24 hours of arrival on holiday and seven in ten (69 percent) within two hours of arrival[iv], Booking.com, compiled the top destinations to explore for favorite gastronomic pleasures, according to millions of Booking.com travel reviewers.
Pizza lovers should head to Naples, Italy, as Booking.com travelers rank this the best destination for the perfect pizza in their reviews. Celebrated for culinary know-how, Naples offers not only the best pizza but is a Unesco World Heritage Site with impressive archaeological riches to explore before a break for the iconic Neapolitan pizza with tomatoes and mozzarella cheese, a slice of heaven!
For sensational seafood check out Los Abrigos found on Spanish Canary Island, Tenerife's south coast. The sun soaked coastal village is awash with colorful fishing boats and the charming harbor is the perfect backdrop to enjoy the local shellfish.
Try delectable dim sum in Trang, Thailand. This tranquil hideaway offers secluded beaches and sublime turquoise waters on Thailand's far southern coast. Ahead of a day spent relaxing on the fine white sands or uncovering the lagoons, waterfalls and hidden caves, enjoy a local tradition of dim sum for breakfast alongside some real Thai coffee.
Tokyo takes the first place for both sushi and ramen, no surprise as one of the world's most exhilarating dining destinations and the city boasts the world's highest volume of Michelin stars in any city. Beyond savoring these popular specialty dishes there is so much to see and do in this neon-bright lively city.
In addition to the pure pleasure of tasting new dishes, travelers can also get a thrill from taking photos of their food and sharing with others. This is a growing trend and what better time to get the most beautiful shot then from combining new food and travel. From the precision and beauty of gourmet dishes in uptown New York, to the color explosions in the street stalls of Indonesia, these moments provide the perfect opportunity to create mouth-watering photos for your social feeds.
The nationalities who are snapping and posting the most photos when it comes fanciful food in Booking.com reviews, are the artistic English, followed by the tech-savvy Americans and true food aficionados the Italians[v].
Top 10 nationalities posting the most photos of food in their reviews
1 English
2 American
3 Italian
4 Russian
5 Chinese
6 Spanish
7 Japanese
8 German
9 French
10 Australian
Pepijn Rijvers, Chief Marketing Officer at Booking.com commented: "Sometimes, there's no better way to get to know a destination than through their food. By using realtraveler reviews and recommendations, you too can discover the best places to indulge in your favorite (or soon to be favorite) dishes. Not only does food play into the traveler's decisions of choosing their next destination, but it also plays into accommodation choices, as almost a third (30 percent) of people think it's important to have a great restaurant to take advantage of in an accommodation.[vi] With over 1.2 million diverse accommodations to choose from on Booking.com, there are always opportunities to discover your next foodie hotspot!"
Factory Farming Opinion
A new poll conducted by NRG Research Group shows four out of five Americans want food companies to commit to greatly reducing the suffering of chickens in their supply chains, even if it results in higher prices.
The poll surveyed consumers on improving each step of a broiler chicken's life, from genetic selection to slaughter. Key findings include the following:
- 83 percent oppose using chickens bred to grow so fast they often become crippled under their own weight and support switching to breeds with higher welfare outcomes
- 76 percent support ending live-shackle slaughter in favor of less cruel systems that eliminate the suffering caused by shackling, shocking, and slitting the throats of conscious animals
- 78 percent oppose extreme crowding by which each chicken is provided with less than a square foot of floor space
- 78 percent support banning these conditions even if per-pound cost of chicken meat increases
Respondents also strongly support measures such as keeping chicken litter clean enough to prevent eye sores, flesh burns, and respiratory distress; providing environmental enrichment, such as straw bales and pecking objects, so chickens can engage in natural behaviors; improving lighting standards, including at least six hours of darkness each day to avoid further accelerating the chickens' growth; and implementing third-party auditing programs to ensure laws and commitments are not violated.
Dozens of leading food businesses, including Subway, Burger King, Chipotle, and Panera Bread, have already adopted meaningful chicken welfare standards to end the worst abuses in their supply chains. But Tyson Foods, the biggest poultry producer in the U.S., recently announced standards that fail to adequately address the most pressing chicken welfare issues. This new poll comes on the heels of Tyson's announcement.
"Chickens are the most abused animals on the planet," said Brent Cox, vice president of corporate outreach with Mercy For Animals. "The longer Tyson Foods, Wendy's, and other companies wait to prevent the worst forms of animal abuse in their supply chains, the more they set themselves apart as out of touch with consumer expectations and the latest science on animal welfare."
People Love Ice Cream
Whether it’s gelato, sundaes or sorbets, ice cream in all varieties has remained popular for centuries and it seems that in the US, consumers aren’t straying far from the classics even amidst their quest for a healthy lifestyle. New research from Mintel reveals that retail sales of frozen yogurt and non-dairy ice cream slipped 10 percent in the last two years, reaching an estimated $299 million in 2016. Meanwhile, the ice cream and frozen dairy desserts segment grew seven percent 2014-16 to reach an estimated 6.8 million.
It appears that attitudes support consumers’ desire to indulge with ice cream. Only one in ten (11 percent) US consumers report cutting back on ice cream or frozen treat consumption due to health concerns. In fact, an almost equal share (10 percent) report actively avoiding healthy versions because they are “meant to be treats.” More than one quarter (27 percent) of ice cream buyers agree that, even though they find these treats unhealthy, they buy them anyway.
Despite waning interest in the US, ice cream aisles across the globe have been experiencing a dairy-free makeover as many consumers are looking to cut down on their dairy consumption. The share of global dessert and ice cream launches featuring a vegan claim has increased from two percent in 2014 to four percent in 2016, with Europe accounting for 59 percent of all launches in 2016.
“Many of the pleasures that consumers get from frozen treats, such as satisfaction of cravings and an enjoyable indulgence, simply outweigh health-related concerns for the vast majority of Americans. As a result, we’re seeing a decline in retail sales for the frozen yogurt and non-dairy segment, which typically carries a health halo. Although soft-serve yogurt remains popular in specialized frozen yogurt parlors, the harder frozen yogurt packaged like ice cream continues to lose traction, indicating that even products with healthy claims need to ensure they maintain their appeal as a treat,” said Mimi Bonnett, Director, US Reports, Food, Drink and Foodservice at Mintel.
Overall, the global ice cream market is expected to scoop sales of 13 billion liters in 2016, with India, Indonesia and Vietnam among the world’s fastest growing markets. India’s ice cream market has experienced a Compound Annual Growth Rate (CAGR) of 13 percent over the past five years, with sales forecast to reach 381.8 million liters in 2017 and 657.2 million liters by 2021. On the homefront, volume sales of ice cream in the US have been stagnant, experiencing a CAGR of -1 percent over the past five years.
Currently, the US is the world’s second largest ice cream market with sales estimated at 2.7 billion liters in 2016, falling just behind China at 4.3 billion liters. However, in terms of individual ice cream consumption, Mintel research reveals that Norwegian consumers are the biggest ice cream eaters, consuming 9.8 liters per capita in 2016, followed by Australia (9.4) and Sweden (8.9). The US ranks fourth, with Americans consuming 8.4 liters per capita in 2016.
“Food historians credit China with inventing ice cream and Marco Polo for introducing it to Italy on his return from the Far East. Skip forward to the 21st century and the rate at which Western ice cream makers are looking to the East for inspiration promises to see renewed momentum,” said Alex Beckett, Global Food and Drink Analyst at Mintel. “The rapidity with which India’s ice cream market is expanding is worth noting. The low per capita consumption of retail ice cream in India demonstrates the exciting potential in what is the world’s second most populated country, although competition from street vendors should not be underestimated.”
Indeed, with the East’s love of ice cream thickening, one in three (32 percent) ice cream products were launched in Asia Pacific in 2016, up from 26 percent in 2013. What's more, the share of ice cream products launched in North America fell from 19 percent to 14 percent in the same time period.
Clearly keen to get a scoop of the product innovation action, Western consumers are increasingly looking to try ice cream products with more Eastern inspired flavors. Nearly one third (30 percent) of Canadians would be interested in ethnically-inspired ice cream flavors, such as green tea or mango, while one quarter (23 percent) would be interested in internationally inspired formats, such as Japanese mochi ice cream or Indian kulfi.
“In the US, mochi ice cream, the Japanese treat of frozen rice dough around an ice cream filling, is set to continue growing in profile in 2017. Meanwhile, Thai-style rolled ice cream also continues to gain food press headlines across North America, often pitched as the next big thing in desserts. The Middle East also promises to become more influential for ice cream innovation. In particular, booza, a traditional type of ice cream from Syria and Lebanon, has one clear advantage which should resonate the world over: it is very slow to melt,” concluded Beckett.
Top Five Ice Cream Favorites Among Americans
While vanilla ice cream continues to reign supreme as America's favorite, chocolate-filled flavors dominate the top five bestselling ice cream flavors according to a recent survey of ice cream makers and retailers across the United States. The survey was conducted by the International Dairy Foods Association (IDFA) among its members who make and market ice cream as well as members of the National Ice Cream Retailers Association, which includes operators of ice cream parlors in the United States.
IDFA released the results to launch its celebration of National Ice Cream Month, which runs throughout the month of July.
According to the survey, America's top five flavors are: vanilla, chocolate, Cookies N' Cream, Mint Chocolate Chip and Chocolate Chip Cookie Dough.
"Vanilla has long been the best-selling ice cream flavor not only because it is creamy and delicious, but also because of its ability to enhance so many other desserts and treats," said Cary Frye, IDFA vice president of regulatory and scientific affairs and nationally respected expert on ice cream and frozen desserts. "It tastes great topped by whipped cream and fudge sauce in a sundae, with root beer in a float or atop a warm slice of apple pie."
When asked to name their most daring and creative flavors, the respondents listed less traditional options including Lemon Poppyseed Muffin, Black Sesame and a bourbon- and caffeine-spiked concoction called Exhausted Parent.
Survey results also confirmed that many ice cream makers and retailers have family-owned businesses, have been in operation for more than 50 years and primarily market their products locally and regionally.
Ice Cream Across America
From neighborhood scoop shops to national brands, the ice cream industry in the United States contributes more than $39.0 billion to the national economy and creates more than 188,000 jobs nationally.
The Great Lakes region of the United States in particular, which includesIllinois, Indiana, Michigan, Ohio and Wisconsin, is a hot spot for the chilled treat. For respondents who market their products regionally, the area earned the top spot for the most successful and the most served market.
Respondents also ranked the Southwest, Plains and the Mideast regions as their next most successful markets, helping to answer the often-asked question: "Which region consumes the most ice cream?"
À La Mode
When asked about ingredients added to ice cream, the majority of those surveyed said that pecans are the most popular nut or nut flavoring, while strawberries are the most popular fruit added to their frozen treats.
Waffle cones and sugar cones were voted as equally popular containers with consumers, while ice cream sandwiches came out on top as America's favorite novelty product. Respondents voted the ice cream sandwich as their best-selling novelty over ice cream cups, pops, cones and bars respectively.
Plant-Based Ice Cream Growth
Future Market Insights' recent report on the global market for plant-based ice-creams reveals the impact of lactose intolerance in creating a vast consumer base for such non-dairy products. Increasing population of lactose intolerant consumers is observed to be driving force for growing consumption of plant-based ice-creams. Moreover, higher protein content in plant-based ice-creams is making them healthier options among ice-creams. Producers of plant-based ice-creams are focusing towards improving the taste of these ice-creams as consumers are demanding a wide variety of flavours. Following highlights from the report will elucidate the growth of global plant-based ice-creams market during the forecast period, 2017-2027.
According to the report:
- The global market for plant-based ice-creams will reach a value of US$ 1 Bn by the end of 2017, recording an estimates sales of 194.5 thousand tonnes of plant-based ice-creams. Towards the end of 2027, the global consumption of plant-based ice-creams will reach 500 thousand tonnes, reflecting an estimated value of US$ 2.45 Bn.
- Voluminous growth of the global plant-based ice-creams market will be marginally lower than its revenue growth as the market is expected to reflect of a volume CAGR of 9.1 percent and a value CAGR of 9.3 percent over the forecast period.
- In 2017, close to 60 percent of global plant-based ice-creams revenues will be accounted by sales of bars and cones. Demand for cups or tubs of plant-based ice-creams, on the other hand, will gain traction as global sales recorded in this product segment will contribute to nearly 30 percent of global market value by the end of 2027.
- In 2017 and beyond, the global demand for plant-based ice-creams in single-flavour form will be slightly lower than that of blends as the latter form of plant-based ice-cream will dominate with a global revenue share of 51 percent and above.
- The report predicts that fruits, dry fruits (nuts) and beans will be prominent flavours of plant-based ice-creams. By 2027, nearly 140 thousand tonnes of fruit-flavoured plant-based ice-creams are expected to be consumed across the globe.
- Majority of plant-based ice-creams produced in the world will be sourced from soy milk. Through 2027, plant-based ice-creams sourced from soy milk are predicted to reflect a 10.1 percent CAGR in terms of revenue.
- Global revenues accounted by direct sales of plant-based ice-creams will be gaining traction throughout the forecast period, registering a value CAGR of 10 percent . On the other hand, indirect sales channels for plant-based ice-creams are dominating the market with nearly 60 percent value share, albeit, their global revenue contribution is expected to incur a considerable decline by 2027-end.
- By the end of 2027, North America and Western Europe are expected to dominate the global plant-based ice-creams market as these regions will individually attribute to an estimated 34 percent of global revenues.
- The Asia-Pacific excluding Japan (APEJ) region is also accounting for a considerable share in global revenues, however, consumption of plant-based ice-creams is expected to lose traction in the APEJ market towards the latter half of the forecast period.
- The report also profiles prominent players in the global plant-based ice-cream market, which include Ben & Jerry's Homemade Inc., Bliss Unlimited, LLC, LUV Ice Cream LLC, SO DELICIOUS DAIRY FREE (Danone), Oatly AB, Jollyum Co., The Booja-Booja Co., LITTLE BABYS ICE CREAM LLC, Klein's Ice Cream Inc., and Frankie & Jo's. Other key players in the market are observed to be Happy cow ltd., Tofutti, Breyers, Dream, Nadamoo, ARCTIC ZERO, Inc., Snowflake Luxury Gelato, Wink Frozen Desserts, Nobó ltd., Imuraya Group Co. Ltd.
Canadians Love Cookies
When it comes to sweet baked goods, it seems Canadians have a clear favorite. New research from Mintel reveals that nearly three quarters (72 percent) of Canadians eat cookies*, making it by far and away the nation’s most popular sweet baked good. Other top contenders making the list of Canada’s favourite baked goods include muffins (57 percent), cakes (53 percent), donuts (45 percent) and pastries (44 percent).
Despite the popularity of cookies from coast to coast, it appears not all generations see eye to eye with regard to their favourite sweet baked goods. Younger consumers aged 18-44 are more likely to eat donuts (49 percent vs 39 percent of consumers 45+), bars (38 percent vs 29 percent) and cupcakes (37 percent vs 21 percent); meanwhile, those aged 45+ have a sweet tooth for pies (50 percent vs 39 percent of 18-44s).

There seems to be a sense of nostalgia when it comes to indulging in baked goods as one third (32 percent) of consumers agree that sweet baked goods take them back to their childhood. However, any time is a good time for a cookie or a brownie for the 31 percent who say that sweet baked goods are a good snack, particularly among younger consumers aged 18-24 (41 percent).
“Cookies take the number one slot in terms of popular sweet baked goods, even beating donuts – possibly the most intrinsically Canadian of all sweet baked goods. Given their flexibility and portability, it is not surprising that cookies are eaten more than other sweet baked goods,” said Joel Gregoire, Senior Food and Drink Analyst at Mintel. “Our research suggests baked goods that are more portable prove more popular among younger Canadians, indicating pie makers may look to innovate toward individual occasions in an effort to grow share among these consumers in order to further develop the category.”
It seems a new generation of bakers are covering their aprons in flour as Mintel research reveals 52 percent of consumers aged 18-24 say they enjoy baking from scratch, including 43 percent of 18-24-year-old males. However, it seems that men’s passion for baking declines dramatically with age. Indeed, today’s young Canadian men are almost twice as likely to say they enjoy baking from scratch as men aged 65+ (23 percent). Overall, 45 percent of Canadian consumers agree they enjoy baking from scratch.
Highlighting the importance of scratch baking, Canadians are far more likely to opt for baking sweet goods from scratch (69 percent) than baking from mixes (39 percent) or pre-made refrigerated dough (39 percent). Despite the popularity of baking, however, Canadians are still most likely to get their baked goods from an in-store bakery (74 percent), and nearly two thirds (63 percent) go to store shelves.
“While much has been written about cooking being a ‘lost art,’ our research highlights a sweet future for baking among Canadians, with enjoyment being a key driver. Young Canadians' passion for baking signifies an opportunity to invest in winning young men over to spur growth in scratch baking,” continued Gregoire. “One of the simplest ways for companies and brands to engage these interested younger consumers, and perhaps help them learn the craft, is through social media, particularly through how-to videos, appealing visuals and smartly-positioned branded content.”
In the pursuit of living healthier lifestyles, sugar remains a concern for Canadians. When it comes to purchasing sweet baked goods, interest in products with reduced sugar (24 percent) eclipses demand for products with GMO-free ingredients (11 percent), as well as products that are gluten-free (six percent) and nut-free (four percent). What’s more, over two in five (45 percent) consumers are interested in trying sweet baked goods with alternative sugar ingredients.
Young women aged 18-24 are the most likely demographic to say that sweet baked goods are bad for their health (46 percent) compared to 30 percent of Canadians overall. Meanwhile, two in five (43 percent) Canadians agree they are concerned about the amount of sugar in sweet baked goods. Despite these concerns, price (67 percent) and flavour (60 percent) rank as the most important factors to consider when purchasing sweet baked goods. What’s more, two thirds (66 percent) of Canadians agree that it is okay to occasionally indulge, regardless of nutrition.
“While Canadians turn to sweet baked goods for indulgence, this can create challenges as consumers increasingly look for better-for-you options. Although there is a core group who look for gluten-free products, it’s a relatively small one. Sugar remains the biggest concern for consumers, but companies can leverage different tactics, including alternative sugar ingredients and local ingredients, to address this obstacle,” concluded Gregoire.
*last three months leading to February 2017
The Paper Towel v. Air Dryer Hand Drying Debate
To identify which hand drying method is preferred in the U.S., Cintas Corporation commissioned a survey conducted online by Harris Poll, May 19-23, among 2,048 U.S. adults ages 18 and older. The study found that the majority of American’s (69 percent) prefer to use paper towels over air dryers when drying their hands in public restrooms.
“Hand drying plays an important role in effective hand hygiene,” said John Engel, Director of Marketing, Cintas. “Studies show that germs can be more easily transferred to and from wet hands, which is why drying hands after washing them is essential to staving off bacteria and limiting the spread of infection.”
Of those that chose paper towels as their preferred method to dry their hands in a public restroom, the top five reasons include:
|
• |
Paper towels dry hands better |
70 percent |
||||||
|
• |
Paper towels dry hands faster |
69 percent |
||||||
|
• |
Paper towels provide something to open the restroom door with |
52 percent |
||||||
|
• |
Air dryers blow bacteria (e.g., on hands, in the air) |
24 percent |
||||||
|
• |
Air dryers are too loud |
22 percent |
||||||
“What this data tells us is that the majority of Americans want a quick, thorough and hygienic public restroom experience,” added Engel. “While paper towels reduce the number of bacteria on hands, air dryers increase them, leading to further contamination of not only clean hands, but other restroom users up to six feet awayi. This makes paper towels a ‘no brainer’ choice for hand drying.”
Paper towels are not only more hygienic, but they are also better for the health of restroom users’ ears. In fact, jet hand dryers have the same impact on ears as a close-range pneumatic drill, and are especially dangerous for children’s ears as air dryers are typically positioned at the same height as a child’s headii.
The survey also found that age is a factor in the paper towels vs hand dryer debate. Seventy-six percent of Americans aged 35-44 prefer paper towels compared to only 60 percent of those aged 18-34. Additionally, women are more likely than men to prefer paper towels with 73 percent and 66 percent, respectively.
American Wine Consumers Overwhelmingly Prefer Cork
The Portuguese Cork Association (APCOR) and the California-based Cork Quality Council announced results from a joint study conducted by U.S. wine market research company, Wine Opinions, to understand the attitudes and purchase behaviors of American wine consumers toward wine closures. In addition to cork being seen as an indicator of wine quality by as much as 97 percent of respondents, findings also revealed that natural cork is the closure of choice for wine purchased at a restaurant (91 percent), wine purchased as a gift (93 percent), and wine purchased to bring to a dinner party (86 percent).
Reasons respondents stated for preferring cork were led by the notion that natural cork evokes an important sense of heritage, while the enjoyment of opening wine sealed with a cork, the “pop” and the “ritual” creating a unique distinctiveness at the moment of consumption were also cited. Importantly, respondents also found cork to be conducive to wine aging, a marker to check the quality of the brand before purchasing, and an indicator of overall quality. A total of 1,549 consumers participated in the study and questions asked were cross-tabulated by gender, age, frequency of consumption, price bracket of purchases, importance of closure type, and those who age their wine.
One surprising finding from the survey, according to Executive Director Peter Weber of the Cork Quality Council, was that consumers still need help understanding and appreciating the environmental and social benefits of natural cork over plastic stoppers and screwcaps.
“The fact is that cork is a 100 percent renewable and sustainable natural resource, harvested every nine years without damaging the tree. It not only provides important CO2 retention, a crucial tool to fight climate change, it also provides one of the world’s 36 most important biodiversity hotspots. In the era of climate change, education about natural cork’s environmental and social benefits is becoming more and more of a focus, and we still have work to do to fully engage the public on this topic,” notes Weber.
The positive environmental attributes of natural cork have also been recognized by the International Organisation of Vine and Wine (OIV), the world’s governing body for global wine production. In the 2011 "General Principles of the OIV Greenhouse Gas Accounting Protocol for the Vine and Wine Sector," OIV’s resolution to help address the harmful effects of climate change encouraged wineries around the world to consider each individual cork’s ability to retain as much as 3.95 ounces when calculating the carbon footprint of bottled wine.
Worldwide On-the-go Breakfast Packaging Market Increasing
The global on-the-go breakfast packaging market is characterized by the presence of a large number of players that renders the vendor landscape highly competitive, says Transparency Market Research (TMR) in one of its recent reports. Some of the leading companies are Amcor Limited, Bemis Company Inc., Berry Global Inc., Sealed Air Corporation, Sonoco Products Company, and Tetra Pak International S.A. A
As per the report by TMR, the global on-the-go breakfast packaging market is expanding at a steady CAGR of 5.1 percentbetween 2017 and 2025. At this pace, the market's valuation of US$743 mn in 2016 will reach US$1.1 bn by 2025.
Flexible Packaging Displays High demand Globally
The global on-the-go breakfast packaging market has been segmented into rigid packaging and flexible packaging based on packaging type. Flexible packaging is the dominating segment due to the convenience associated with light weight packaging. It is expected to remain in the lead in the foreseeable future too.
By material type, plastic dominates the on-the-go breakfast packaging market with the segment expected to account for 56.1 percentof the market by the end of 2017. From a geographical standpoint, Europe stands as the leading regional market for on-the-go breakfast packaging, however, Asia Pacific is expected to display the leading CAGR of 5.3 percentbetween 2017 and 2025.
The global on-the-go breakfast packaging market has been witnessing robust growth on account of several factors, which includes changing lifestyle of people, with more consumers preferring on-the-go food. Growing number of nuclear family set-ups in urban areas with both the partners working does not leave adequate time for home cooking on a regular basis. This is fuelling the demand for packaging for on-the-go foods.
Increasing Purchasing Power in Developing Countries Bodes Well
Another factor catalyzing growth of the on-the-go breakfast packaging market is the rising trend of large number of single persons moving out of home for work reasons. Due to time crunch they do not get much time to prepare first meal of the day, which is fuelling the demand for prepared breakfast options and indirectly benefitting the on-the-go breakfast packaging over the forecast period.
Besides this, rising per capita expenditure on prepared food generally on account of rising purchasing power is also generating a high demand for on-the-go breakfast packaging market. With increasing trend of ready-to eat meals, the demand for on-the-go breakfast packaging is expected to continue over the forecast period.
On the flip side, the growth of the on-the-go breakfast packaging market is negatively impacted due to several factors. Low level of awareness about on-the-go breakfast options among consumers in developing countries and adherence to traditional eating habits is posing a challenge to the growth of this market. Moreover, weak distribution networks for on-the-go breakfast packaged products in developing countries is a significant factor expected to impact the growth of the market over the forecast period.
Nevertheless, availability of natural and organic on-the-go foods with additional health claims will present opportunities to the growth of on-the-go breakfast packaging market.
Entrance Floor Mat Market
Technavio has announced the top five leading vendors in their recent global entrance floor mat market report until 2021. This research report also lists ten other prominent vendors that are expected to impact the market during the forecast period.
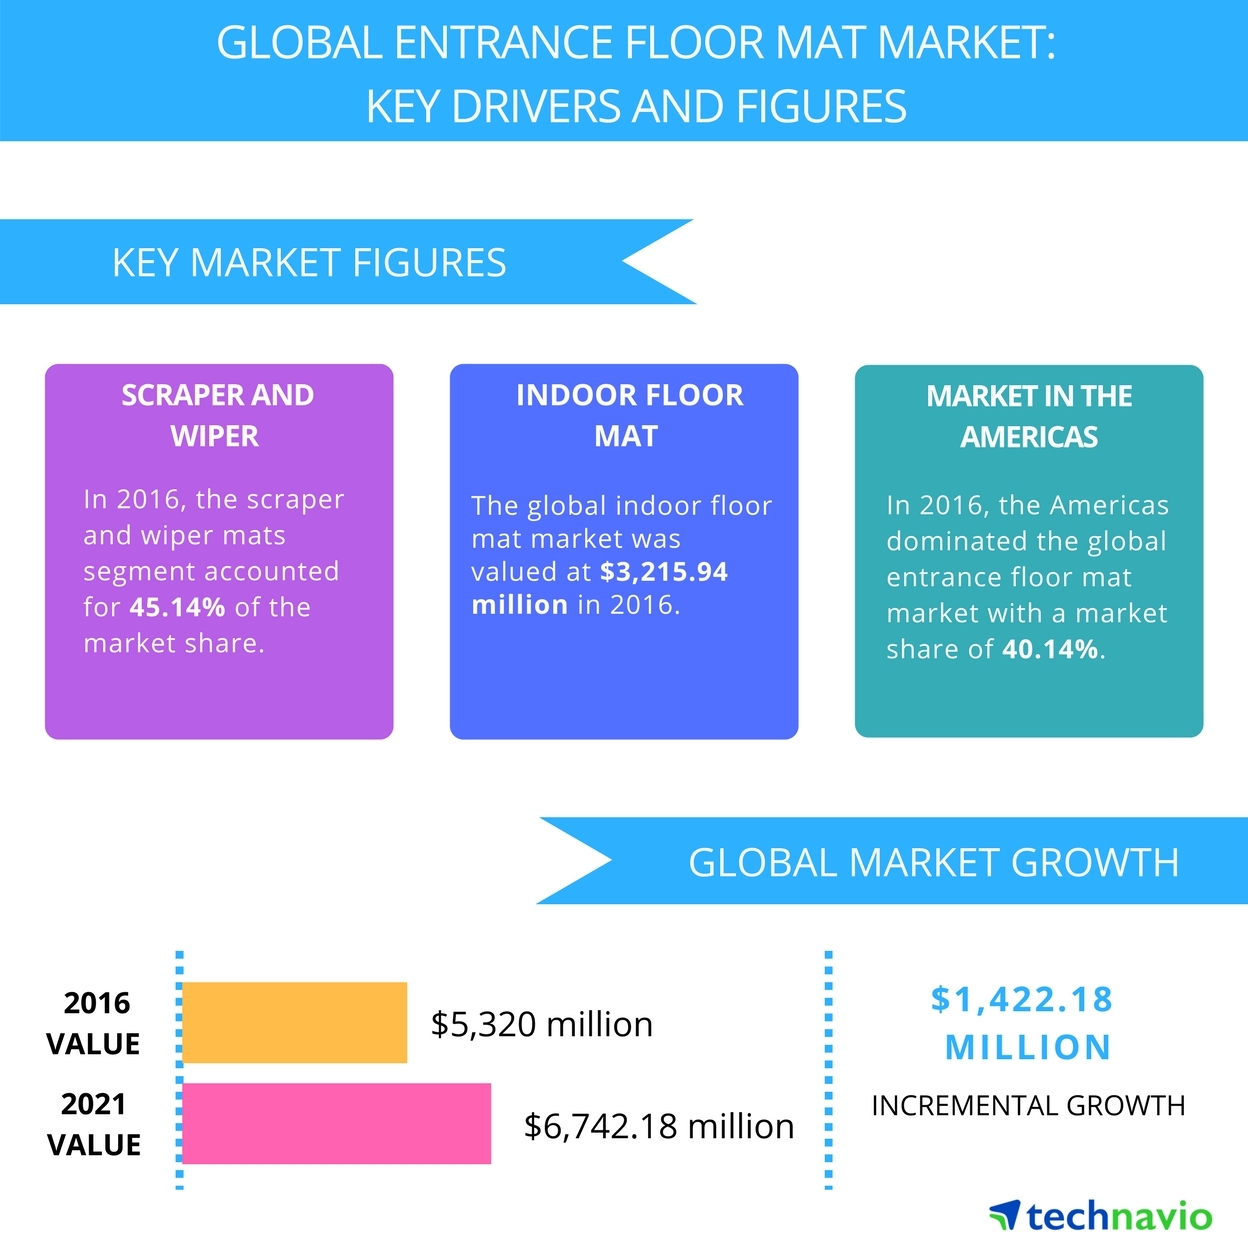 The research study by Technavio on the global entrance floor mat market for 2017-2021 provides a detailed industry analysis based on the product (scraper and wiper floor mat, anti-fatigue floor mat, logo floor mat, and specialty floor mat), application (indoor and outdoor), material (coir, cotton, and nylon), end-user (commercial and residential), and geography (the Americas, EMEA, and APAC).
“The global entrance floor mat market is projected to grow to more than USD 6,700 million by 2021, at a CAGR of nearly 5 percentover the forecast period. Product differentiators such as attractive colors and innovative materials used in products are attracting more consumers to this market,” says Poonam Saini, a lead analyst at Technavio for retail goods and services research.
Competitive vendor landscape
The global entrance floor mat market is highly competitive with the presence of major vendors, small players, and various unorganized players. It is imperative for vendors in the market to differentiate their product offerings through clear and unique value propositions to survive and succeed in this stiff competitive environment.
Many players in the market are focusing on developing new and innovative floor mats that help to differentiate themselves in the market. Development of new products relies heavily on both long-term and short-term financial investments. Players often engage in price wars by offering promotional offers or lowering their product prices to maintain their existing position in the market.
Top five vendors in the global entrance floor mat market
3M
3M offers safety and electronics, graphics, industrial, and consumer-related products. It operates in the industrial, healthcare, safety and graphics, electronics and energy, and consumer segments.
Cintas
Cintas designs, manufactures, and implements corporate identity uniform programs. Its offerings include entrance mats, promotional products, restroom supplies, fire protection, document management, and first-aid and safety services.
Forbo International
Forbo International sells and manufactures construction and flooring adhesives along with power transmission and conveyor belt solutions. The company produces, develops, and sells linoleum, entrance flooring systems, needle felt floor covering, vinyl floorings, Flotex – the washable textile flooring, and construction and building adhesives through this segment.
NoTrax
NoTrax manufactures several floor mats. It offers safety and anti-fatigue, logo, entrance, dissipative and anti-static, insulative and non-conductive, and specialty mats for residential and commercial customers. The company sells its products through a network of distributors in Canada, the US, and Mexico, and online distributors.
UniFirst
UniFirst designs, manufactures, and sells uniforms and protective clothing including pants, shirts, coveralls, jackets, smocks, lab coats, aprons; and specialized protective wear. It also sells floor mats, facility service products, dry and wet mops, and wiping mops.
Lemon Prices Rise
Runzheimer, a relocation and business vehicle data provider, recently performed their annual study based on their goods and services pricing. Runzheimer's data showed that the average price of lemons is up over 18 percent  from this same time last year. This significant year over year increase could take a bite out of profit margins, which may translate to a higher price point next time you stop at your neighborhood lemonade stand.
Runzheimer collects goods and services costs across the U.S. and Canada for the purposes of calculating living cost comparisons across locations. Such comparisons are used by organizations that relocate employees to new work sites, calculating cost-of-living allowances. Other organizations use Runzheimer's data to create geographic salary differentials when creating competitive compensation strategies across labor markets.
The study includes prices from almost 100 communities across 65 major metropolitan areas.
The data collected includes a regional breakdown which demonstrates the change in prices based on specific regions of the country:
|
REGION |
2016 |
2017 |
Percent Change |
|
NORTHEAST |
$1.83 |
$2.07 |
13.1 percent |
|
MIDWEST |
$1.71 |
$2.03 |
18.7 percent |
|
SOUTH |
$1.47 |
$1.76 |
20.2 percent |
|
WEST |
$1.57 |
$1.88 |
19.4 percent |
Growth in Mobile Usage for Hotel Stays
According to the J.D. Power 2017 North America Hotel Guest Satisfaction Index Study,SM released today, incorporating mobile apps and functionality into a hotel stay is associated with higher guest satisfaction. Integrating this technology also makes guests more willing to share their positive hotel experiences on social media.
The risk for hotels is that greater use of mobile devices for booking means some guests might secure a room with an online travel agency (OTA), which is associated with lower satisfaction. The industry is currently emphasizing direct booking, where a hotel guest rents a room directly through the hotel rather than another way. Pushing for more guests to become rewards members will likely enhance this effort. While OTAs remain popular among many guests, there are some disadvantages to their use, such as the need to deal with a third party if problems arise with a reservation.
"As mobile usage becomes increasingly ubiquitous for guests, the challenge for hotels becomes twofold: First, they must persuade guests to book directly with them, and second, they must encourage easy utilization of this technology," said Rick Garlick, practice lead, travel and hospitality at J.D. Power. "By forging direct relationships, hotels can become guardians of the guest experience, but at the center of these relationships is an establishment's mobile strategy."
The study, now in its 21st year, measures overall guest satisfaction across eight hotel segments: luxury; upper upscale; upscale; upper midscale; midscale; economy; upper extended stay; and extended stay. Seven key factors are examined in each segment to determine overall satisfaction: reservation; check-in/check-out; guest room; food & beverage; hotel services; hotel facilities; and cost & fees. Satisfaction is calculated on a 1,000-point scale.
Following are key findings of the 2017 study:
Direct booking: When guests book through an independent travel website or mobile app (e.g., Expedia, Travelocity) instead of directly with the hotel, they are more likely to experience a problem and to be less satisfied with their stay.
Membership matters: Hotel rewards members are far more likely to book directly with a hotel or on a loyalty member site than those who are not members (75 percent vs. 47 percent, respectively), and their satisfaction is higher. The number of those who book through OTAs is increasing (19 percent in 2017 vs. 16 percent in 2013), despite the concerns some guests have ranging from earning hotel rewards to strict cancellation policies.
Mobile mania: In 2014, 14 percent of online reservations were made using mobile means (smartphone or tablet), and now that percentage is 25 percent . Those utilizing mobile reservations are more likely to be younger or business travelers.
Not so mobile mania: Among guests who have a hotel's app on their mobile device, 38 percentdon't use it during their stay. Only a tiny percentage of check-ins (four percent) and check-outs (one percent) occurs through mobile apps, but when it is used, it is associated with higher guest satisfaction.
Get 'em to try the app: Guests who download and use a hotel's mobile app are more satisfied and have greater loyalty to that brand. While only 19 percentof all guests have downloaded a hotel app, 70 percent of rewards members have done so.
Social media surprise: Despite the perception that people posting to social media only do so to complain, guests describing their experience via these channels appear to be more satisfied overall. At the same time, those who do experience a problem are extremely likely to post to social media (86 percent).
Reading is fundamental: Slightly more than half (52 percent) of guests have read a review of a hotel, industry news or an online forum in the past month, and 46 percentof those guests wrote a review in the past six months. Review readers and writers are also more likely to have higher guest satisfaction.
Hotel Segment Rankings
"While The Ritz-Carlton and JW Marriott rank highest in the luxury segment, both of these Marriott-affiliated brands appeal to different types of customers," Garlick said. "It's important to remember that this study measures guest satisfaction among a hotel brand's own customers and doesn't directly compare hotel brands to one another. Often, the type of guest becomes an important element in determining satisfaction rankings."
The following hotel brands rank highest in guest satisfaction in their respective segments:
Luxury: JW Marriott and The Ritz-Carlton1 (tie)
Upper Upscale: Hyatt
Upscale: Hilton Garden Inn (for a second consecutive year)
Upper Midscale: Drury Hotels (for a 12th consecutive year2)
Midscale: Wingate by Wyndham (for a third consecutive year)
Economy: Americas Best Value Inn
Upper Extended Stay: Staybridge Suites
Extended Stay: Candlewood Suites
The Cure for the Store
It’s no secret that retail is facing arguably the most dramatic sea change in decades. While brick-and-mortar stores remain popular for consumers in today’s unified commerce environment, online options are increasingly drawing traffic away from the store. As evidenced by the findings of the third annual JDA Consumer Survey of more than 1,000 U.S. consumers conducted by JDA Software Group, Inc., about 54 percent of respondents reported that they prefer to shop in-store over other channels, like online, mobile and social media (tweet this). Almost half (46 percent) prefer to skip the store altogether in favor of digital channels. Survey findings confirm that services promoting convenience will be crucial in maintaining that majority of brick-and-mortar shopping. For instance, a quick and easy shopping experience was favored over a personalized experience by three in four respondents (tweet this), and year over year data showed a steady 44 percent increase in convenient buy online pickup in store (BOPIS) adoption since 2015.
“Our 2017 Consumer Survey highlights the changing role of retail stores,” said Jim Prewitt, vice president of retail industry strategy at JDA. “While there has been speculation of a ‘retail apocalypse,’ that doesn’t seem to hold true for consumers. No longer the only channel for shopping, brick-and-mortar stores are still a key cornerstone for a quick and easy shopping experience and the facilitator for popular fulfillment options, like BOPIS and buy online return in store (BORIS).”
IS BOPIS a Cure for the Store?
According to the survey, half of respondents used BOPIS services in the last 12 months, a 44 percent increase since the 2015 JDA Voice of the Consumer survey. By offering incentives, however, that uptick could rise significantly; 80 percent of shoppers would consider using the service if retailers offered price discounts or incentives. This would in turn add value to the consumer shopping experience, while pushing retailers to differentiate themselves among competitors through special offers.
“While some retailers are already testing out ways to incentivize consumers to choose BOPIS services over home delivery, our research found that this could be a successful way to capture shopper attention in today’s competitive marketplace and further validate the role that BOPIS will play in the success of retail stores,” said Prewitt. “By offering incentives to shoppers to use BOPIS, like discounting, retailers are driving more foot traffic into stores, and potentially, buying more than they intended to, once they arrive at the store, boosting store sales.”
In addition to leveraging existing store inventory and streamlining shipping logistics, BOPIS provides another sales conversion opportunity for retailers. Of the respondents that use buy online pickup in store services, 40 percent “sometimes” made additional purchases in-store.
Of course, BOPIS adoption remains tied to consumers’ desire for convenience. Of the respondents who have used BOPIS services, avoiding home delivery (39.61 percent) and wanting the product sooner (33.14 percent) remain the top reasons for selecting the fulfillment option, similar to findings in 2016 and 2015. And with more retailers successfully implementing the service, 58 percent of respondents did not experience a problem with the service over the last year.
When consumers do experience issues with BOPIS services, they continue to be associated with mismanaged staffing. Twenty-three percent found that store staff took a long time or were unable to find the shopper’s order in their store system, and 16 percent found that there were no dedicated staff in store for BOPIS purchases. This is consistent with 2016 results, and showcases the need to refine workforce management for new fulfillment channels to compete in today’s retail environment.
Returns Drive Consumers in Store as Well
When it comes to returning items bought online, having to pay for return postage and packaging continues to be the biggest frustration for consumers. Nearly one in three shoppers have leveraged buy online return in store (BORIS) services this year, up from only 20 percent in 2016.
Almost half of respondents (44 percent) used BORIS services because an item purchased online was not what they expected it to be; this is up by over 10 percent from 2016. Over 30 percent used BORIS services because they did not want to deal with the hassle of return deliveries, and almost one in five respondents (17 percent) believed they would receive their refund/exchange faster.
Shopping on Social Media
A little over one-fourth of respondents (26.28 percent) have leveraged social media to purchase an item online. Of those who had, respondents ages 18-29 years old were more likely to do so (35 percent) than other age groups. Two popular visual platforms – Facebook (81 percent) and Instagram (26 percent) – were the most widely used social media channels for online purchases.
“Social media continues to be a channel for consumers to browse, but is still emerging as a path to purchase. That means retailers need to continue refining these channels as shoppers begin to embrace them, particularly as the Gen Z generation of shoppers increases,” added Prewitt.
Predictions for the 2017 Holiday Season
Ongoing yearly sales, both in-store and online, are preferred by most shoppers. More than half of respondents (57 percent) would rather complete their holiday shopping throughout the year and outside of the holiday season rush.
When it comes to holiday shopping, 25 percent of respondents favor online Cyber Monday purchases; 12 percent prefer Black Friday in-store deals; and roughly 6 percent prefer making their holiday purchases during Amazon Prime Day. Additionally, the majority of respondents (53 percent) occasionally buy more items than they anticipated/planned to when shopping during a sale event.
Invincibility on Public Wi-Fi
Norton Wi-Fi Risk Report reveals 69 percent of Americans believe their personal information is safe when using public Wi-Fi, yet two-thirds act unsafely when online
Consumers are unable to resist a strong, free Wi-Fi network and their online behaviors may be placing their personal information at risk, according to Norton by Symantec’s 2017 Norton Wi-Fi Risk Report.
“There is a deep divide between what people think is safe when it comes to using public Wi-Fi versus the reality,” said Fran Rosch, executive vice president, Consumer Business Unit, Symantec. “What someone thinks is private on their personal device can easily be accessed by cybercriminals through unsecure Wi-Fi Networks or even apps with privacy vulnerabilities.”
The Norton Wi-Fi Risk Report surveyed more than 15,000 consumers in 15 countries to learn about their public Wi-Fi practices and perceptions. Many of the global findings show that people are aware of the risks of public Wi-Fi, but are not necessarily changing their behaviors. U.S.-specific highlights include:
Consumers Willing to Sacrifice Security for Free Wi-Fi
Consumers’ dependency on a quick, free connection via public Wi-Fi could be placing their personal information at risk:
- Seventy-three percent of Americans are not using a Virtual Private Network (VPN) to secure their Wi-Fi connections, even though it is considered a best way for protecting personal information
- Over 60 percent of Gen Z (ages 18-20) in the U.S. say it’s important to use public Wi-Fi so they can post to social media, while 70 percent say it’s important to use public Wi-Fi to avoid draining their data plan. Interestingly, the value of public Wi-Fi varies for Americans over 72, with 59 percent of them wanting to use public Wi-Fi to help ensure someone important to them can reach them.
Questionable Behaviors on Wi-Fi
And in the case of using public Wi-Fi for more private matters, joining an unsecure network could reveal more about a person’s personal information (or habits) than they bargained for:
- Twenty-two percent admit to viewing adult content on public Wi-Fi
- Of those people, 45 percent admit to doing so at work and 46 percent have done so in a café/restaurant.
- Thirty-five percent have accessed Wi-Fi without the Wi-Fi network owner’s permission; 12 percent guessed or hacked the password to get in.
- Ninety-two percent of Americans have potentially put personal information at risk while using public Wi-Fi, including checking their bank accounts, yet 40 percent reported they would feel horrified if their financial details were stolen and published online by hackers.
Wi-Fi Access Also a Must When Traveling
Clearly, Americans are unable to resist access to a strong, free Wi-Fi network despite the risks. This is especially true while traveling, as Americans say access to a strong Wi-Fi network is a deciding factor when choosing a hotel (75 percent), transport hub (44 percent), place to eat (49 percent) or which airline to fly (50 percent). Further, more than half (51 percent) of people surveyed said that the most important reason to stay connected was to use a GPS app to get around.
Help Ensure Your Personal Information Doesn’t Fall into the Wrong Hands
Despite the need for access to a strong, free Wi-Fi connection, there are simple steps consumers can take to help protect their information online:
Use Security Software: One of the best ways to protect your information online is to use a Virtual Private Network (VPN) from a trusted vendor such as Symantec’s Norton Wi-Fi Privacy. VPNs provide a “secure tunnel” that encrypts data being sent and received between your device and the internet.
Look for HTTPS: Many companies use secure websites — HTTPS (Hypertext Transfer Protocol Secure) — to provide online security. You can tell if a website is secure if it has “https” in its URL and has a small lock symbol next to it. However, even though the website itself might be safe, your personal information could be vulnerable if your network connection isn’t secure.
Sharing Less is Best: Think twice before entering any type of personal information – from passwords, to financial details and photos – over public Wi-Fi networks. Even if you’re not actively sharing the information, your device may be doing so for you. Many devices are programmed to automatically seek connections to other devices on the same network, which could cause your files to be vulnerable. Be sure to disable sharing on your devices to ensure what’s yours stays yours.