
According to a Recent Study/Survey … Mid-March 2017 Edition
35 Min Read By MRM Staff
This Mid-March edition of According to … features falling sales, Pinterest favorites and the rise of flexitarians. As part of our mission to be the go-to resource for on-the-go restaurant industry professionals, Modern Restaurant Management (MRM) magazine offers highlights of recent research.
Little Room for Optimism
Same-store sales fell -3.7 percent in February, with traffic declining -5.0 percent. Unfortunately, January’s improved results were not a turning point in declining industry performance. Trends are hard to discern since weather, holiday shifts in Valentine’s Day and President’s Day and winter breaks distorted weekly results.
A macro view leaves little room for optimism. Same-store sales averaged -2.7 percent for the last three months. February’s results were among the weakest in the last four years. This insight comes from data by TDn2K™ through The Restaurant Industry Snapshot™, based on weekly sales from over 26,000+ restaurant units and 145+ brands, representing $66 billion dollars in annual revenue.
Guest Checks Plummet
Guest checks grew by a modest 1.2 percent in February, the lowest rate in four years. By contrast, checks had grown roughly 2.3 percent in the previous six months. This is a function of more conservative pricing, customer trade downs or discount promotions. All segments experienced a decline in the rate of check growth last month. Casual dining and quick service were virtually flat compared with the prior year. The bar and grill sub-segment actually experienced a drop in average checks versus 2016.
The Macroeconomic Environment
“While the stock market soars and confidence jumps, the economy continues on its steady but unspectacular upward path,” reported Joel Naroff, President of Naroff Economic Advisors and TDn2K economist. “Growth in the first quarter should exceed the tepid pace at the end of last year and with Europe finally starting to recover, the economy should pick up steam as we move through the year.”
Consumers are spending, but they are being battered by rising inflation. The rebound in energy costs may be helping that sector but it is not doing much for households. Indeed, spending power has flatlined as wage gains are barely offsetting price increases. That is putting additional pressure on the restaurant industry.
Still, the labor market is as tight as it has been in decades. Rising wages should lead to better spending in the months ahead. One note of caution: “The higher inflation has given the green light to the Fed to raise rates and if Trump spending and tax policies are implemented, rates are likely to rise faster than most currently expect.”
Income Tax Refund Delay
The IRS delayed roughly 40 million tax refunds associated with families claiming the “Earned Income Tax Credit” or the “Additional Child Tax Credit” this year. These delays undoubtedly depressed sales in the early weeks of February. In 2014, almost 30 million families received more than $70 billion in Earned Income Tax credits. Even a small delay in refunds had the potential to greatly impact consumer spending. Looking forward, the release of refunds provides some upside for the industry in the coming weeks.
Fine Dining and Upscale Casual Winning the Segment Battle
Fine dining and upscale casual were the strongest segments in February. Fine dining was the only segment up overall. The weakest segments, both with same-store sales below -4.0 percent, were casual dining and family dining.
Upcoming: The Easter Effect
Easter is in April this year instead of March. The potential impact varies by segment. Brands where diners tend to celebrate special family occasions, such as upscale casual and fine dining, typically see an increase in sales during these periods. For these segments, same-store sales growth will likely be hurt in March but aided in April. For the dining segments where the holiday shift is less likely to impact consumer behavior, the sales impact will be less pronounced.![]()
The Restaurant Workforce
According to the Q1 2017 Workforce Index published by TDn2K’s People Report™ restaurant operators predict staffing challenges to continue in 2017. However they are increasing at a slightly slower pace. One factor in this relative easing of labor woes is the slowdown in restaurant job growth reported in recent months. At the hourly employee level, 48 percent of restaurant companies reported that they planned to add staff during the first quarter, compared with 66 percent in the fourth quarter of 2016.
For restaurant managers, 50 percent of companies said they would add staff during the first quarter of 2017. The percentage of companies that expected to increase their management staff the previous quarter was 54 percent.
Job growth may be slowing, but both hourly and management turnover continue to rise. As a consequence, recruiting and retaining qualified employees is the top people-related challenge for restaurant operators. TDn2K analysis continues to reinforce that service and guest experience are the key drivers in performance. Best-in-class brands demonstrate that food and beverage are important, but people and service provide unique and indefensible competitive advantages.
The Pinterest Effect
Food is the largest category on Pinterest with 15 billion Pins and counting. Last year there was a 24 percent increase in Pinners who engage with food content and a 21 percent increase in food Pins. People are always hungry for inspiration so they turn to Pinterest to discover new ingredients, evaluate recipes and try new ideas.
Because people use Pinterest to plan, they often get a first look at emerging trends. Search, save and click patterns are like a window into consumer behavior, giving us early insight into what’s popping up on plates across the country. Every now and then we dig into that data, looking for hints about upcoming trends and Pinner cravings. The Insights team looked at save data to see what’s over-indexing in each state, relative to the rest of the country. Here’s the scoop on which dishes and ingredients are disproportionately popular in each state right now:
Northeast: Sweet tooth alert. Searches for sugary treats rose 27 percent in the Northeast last year. That means a spike for peach Schnapps in Pennsylvania, donut cravings in Maine and a growing interest in flower cupcake tutorials in Rhode Island.
Midwest: Midwesterners are curling up with comfort foods, from broccoli salads in Minnesota to taco soup in Oklahoma. Altogether, searches for “comfort food” are up 58 percent for Midwestern Pinners, comprising both meals and snacks.
South: Saves for indulgent food Pins are up 20 percent in the south, but indulgent can mean a lot of things. Louisianians are especially into shrimp pasta, while people in Georgia are more likely to look for wings. And save room for dessert: South Carolina is into red velvet cupcakes these days, while peanut butter fudge is all the rage in Kentucky.
West: The west is trying to keep things healthy, with a 79 percent increase in searches for healthy treats. California digs figs, but Wyoming is getting its boost from energy bites.
Southwest: The Southwest is living up to its name, with searches for recipes like empanadas up 40 percent in the past year. Texas is particularly into stuffed avocados, while Colorado prefers carnitas.
With relevant and useful content, brands can tap into emerging trends on Pinterest well before people start signaling those interests on other platforms. If you’re a food brand, try using these insights to create recipe Pins, ingredient spotlights or cooking tutorials. And even if you don’t sell food, you can have some fun working regional nuances into your creative to pique Pinner interest.
Gecko Hospitality Restaurant Management Salary
Fort Myers-based nationwide hospitality recruitment company Gecko Hospitality has released its second annual Restaurant Management Salary Survey Report for 2016. Data collected in the survey is based on information Gecko Hospitality has obtained directly from restaurant management professionals between January 2016 and December 2016.
The survey reveals information from more than 2,300 hospitality management professionals throughout the United States. Spanning the most popular segments and job titles in the restaurant industry, findings also include: gender, geographic location, turnover, raises, and more.
“For the second year in a row, trends have indicated an overall decline in experienced industry professionals, forcing recruiters to select from a shrinking talent pool,” said Robert Krzak, president of Gecko Hospitality. “However, salaries for woman have increased dramatically in several sectors within the restaurant industry since our last survey in 2015. With these findings, business owners and hiring managers should be more inclined to take proper steps to recognize the shortages and explore alternative hiring methods, such as utilizing specialized recruiting professionals.”
Many recruiting professionals within the restaurant and hospitality industry have noticed the pool of experienced restaurant management professionals declining. By using the most up-to-date data, Gecko Hospitality provides clients and candidates valuable insight to maintain competitive advantage in the industry.
Limited Growth for Canadian Food Services
An increasingly competitive landscape and weakening consumer spending will limit revenue growth to 3.9 percent for Canadian restaurants this year, according to The Conference Board of Canada’s latest Canadian Industrial Outlook: Canada’s Food Services Industry. That would be the industry’s weakest performance since 2011.
“As restaurants vie for Canadians’ food dollars, they will not only be competing against each other for market share, but with grocery stores as well. Dining at home is becoming relatively attractive compared with eating out, given slower growth in income and the fact that prices at restaurants have steadily risen despite a drop in grocery prices over the last year,” said Michael Burt, Director, Industrial Economic Trends, The Conference Board of Canada. “Increased competition in the industry, may drive the less-profitable independent restaurants out of business as they struggle to compete with chains on food prices and keeping up with food trends.”
Highlights
- The number of restaurants in Canada has grown at a rate of 1.8 percent since 2011, well above the 1.1 percent growth in total population.
- Pre-tax profits in the food services industry are forecast to reach $1.6 billion in 2017.
- Canada’s food manufacturing industry is forecast to grow 2.4 percent in 2017.
- Pre-tax profits in the food manufacturing industry are forecast to climb to $4.2 billion this year.
With consumer spending set to moderate due to weak income growth, expansion in restaurant traffic could slow, intensifying the fight for market share. The number of restaurants in Canada has grown at a rate of 1.8 percent per year since 2011, well above the 1.1 percent growth in total population. Meanwhile, steady price growth at restaurants and declining prices at grocery stores are expected to play a role in more consumers opting to dine at home. While restaurant prices grew by 2.3 percent in December 2016, grocery prices contracted by 2.8 percent.
One bright spot for the industry is strong growth in breakfast traffic, which rose by 6.3 percent in 2016 and now accounts for just under one in five restaurant visits. While it has historically been seen as a low-margin, low-revenue market, some fast food restaurants are capitalizing on rising demand for fast and portable breakfast options by introducing “all-day breakfast.”
Tourism activity in 2017, including food services, should benefit from Canada’s 150th anniversary of Confederation and Montreal’s 375th anniversary of its founding. However, over the longer term, the Canadian dollar is projected to gradually strengthen, reducing one of the key factors that has made Canada an attractive destination for international visitors over the last two years. Consequently, growth in spending from international and domestic customers is expected to slow.
Although weakening margins continue to take a bite out of profits, the financial picture of the food services industry will remain stable through 2017. Cost growth will be held in check by weaker food prices and while sales growth will slow, it will remain positive. All in all, pre-tax profits in the food services industry are forecast to reach $1.6 billion in 2017.
Canada’s food manufacturing industry remains a strong performer in the manufacturing sector and can expect solid sales growth of 4.1 percent in 2017, according to the Canadian Industrial Outlook: Canada’s Food Manufacturing Industry.
Canadian food manufacturers will continue to benefit from a strong export outlook largely driven by improving U.S. demand. However, amid growing uncertainty regarding the future of Canada’s trade relationship with its largest trading partner, free trade agreements, such as The Comprehensive Economic and Trade Agreement (CETA), will continue to pave the way for Canadian food exporters to explore new market opportunities and diversify their customer base. CETA will see the elimination of tariffs on most processed foods providing Canadian food manufacturers preferential access to the EU marketplace and a competitive advantage over producers from countries without similar agreements in place.
Weak agriculture commodity prices limited cost increases in 2016 and allowed profit margins to improve. As well, some manufacturers, particularly those that rely on imported inputs, will benefit from a decision by the Canadian government to repeal or amend roughly 200 different tariffs on imported food ingredients to support the competitiveness of Canada’s food manufacturers. However, rising competition among food retailers is limiting the industry’s ability to raise prices for grocers.
Industry margins are expected to soften modestly to 4.0 percent in 2017, but revenue growth will be sufficiently strong to allow pre-tax industry profits to climb to $4.2 billion.
Flexitarian Growth
Today, leading organic meal kit delivery company, Green Chef, announced the results of its 2017 Dietary Fluidity Report. Spurred by the growing trend of the flexitarian diet in mainstream culture, the report examined the proclivity to alter the way we eat – a term Green Chef dubbed “dietary fluidity.” The results of the independent survey confirmed anecdotal customer behavior showing users were keen to try new diets, empowered by the ease of doing so with meal kits. The report found the majority of Americans (57 percent) plan to change their diet in 2017 to get healthy, not thin. In fact, getting healthy (57 percent) far outweighed other common reasons for modifications, including slimming down for an occasion (10 percent) and medical recommendation (10 percent).
“The American way of eating is no longer a one-size-fits-all model. Not only are people changing their diets long term, but they’ll transform them from week to week,” said Michael Joseph, Green Chef CEO and co-founder. “We suspected dietary fluidity was on the rise, but seeing the sheer volume of people planning to alter their diet was striking.”
The report also explored common nutritional programs. Green Chef found a Paleo diet appealed to the most people (20 percent). This is especially true with younger generations – a quarter of respondents age 18-34 ranked Paleo the regimen they were mostly likely to try, whereas a mere 11 percent of 55+ respondents selected it. Only 30 percent of those changing their diet plan to do so by cutting food groups, indicating that Americans are more focused on overall lifestyle changes. For those approaching change by slashing, alcohol was at the top of the list (12 percent), while lactose and gluten were half as likely to get the axe (6 percent each).
Keys findings of the study include:
- More than half the population plans to change their diet in 2017 (52 percent)
- Most people change their diet to get healthier (57 percent), not to slim down for an occasion or for medical reasons
- Most people don’t plan to cut anything from their diet in 2017, but for those slashing, alcohol was at the top of the list (12 percent), while lactose and gluten were half as likely to get the axe (6 percent each)
- Women are less likely to cut something from their diet than men (27 percent vs 33 percent)
- Americans are most likely to try a Paleo diet in 2017 (20 percent)
- Americans overwhelmingly believe they can cook well (72 percent vs. 28 percent)
- Americans care most about quality (41 percent) when it comes to buying food, even over price (30 percent) or level of difficulty to make (20 percent)
- Men are more concerned with quality than women are (46 percent vs. 36 percent)
- Younger generations (18-34 years old) are most concerned with price (42 percent) over all other factors; all older age groups are most impacted by quality
- Americans care more about taste than nutrition when it comes to what they eat (53 percent vs. 33 percent)
Plant-Based Market Grows
The Plant Based Foods Association released new data from SPINS, the leading retail sales data company for the natural and specialty products industry, that shows the total market for the plant-based sector (excluding data from Whole Foods Market) tops $5 billion in sales.
“The steady growth of the plant-based foods industry shows that consumers continue to shift away from animal products towards plant-based options,” said Michele Simon, executive director of the Plant Based Foods Association.
The analysis shows plant-based milk sales leading the way, topping $4.2 billion over the past year, with 13.1 percent growth for refrigerated products in the natural channel.
The data also showed that cheese alternatives are the fastest growing category, with 31.4 percent growth in the natural channel and 18 percent growth in all channels, for a total of $104 million in sales over the past year.
The data comes as a bill was introduced in Congress that would not allow non-dairy alternative products to be labeled with words such as “milk,” “cheese,” or “yogurt.”
According to the SPINS data, total plant-based meat sales exceeded $606 million in sales last year, with refrigerated meat alternatives experiencing especially high growth, at 15.9 percent in the natural channel.
SPINS analyzed data in four categories: non-dairy beverages (refrigerated and shelf stable), cheese alternatives, meat alternatives (frozen and refrigerated), and tofu products over a 52-week period ending January 22, 2017.
The Plant Based Foods Association is a trade association representing 75 of the nation’s leading plant-based food companies.
Canadians Interested in Nutrition
With the rise of superfoods and trends in holistic health, it seems that Canadians are taking a new approach toward nutrition. New research from Mintel reveals that two in three (63 percent) Canadian consumers agree that what they eat impacts their emotional well-being, while over eight in 10 (84 percent) believe it impacts their physical well-being.
It certainly seems that it is what is on the inside that counts as some 45 percent of Canadians say that they are interested in trying the latest foods which claim to boost health, including chia seeds or spirulina, and more than one third (35 percent) try to include superfood ingredients, such as kale, broccoli or quinoa, in their meals. What’s more, two in five (40 percent) say they often do online research to learn about the best foods to eat for a specific need, such as energy, acid reflux or improving skin.
“Canadians are proactively looking after both their physical and emotional well-being. We’ve seen a rise in the trend of ‘beauty from within,’ which has increased attention toward eating foods that improve outward appearance and encourages consumers to seek out foods that address their specific health and wellness needs,” said Carol Wong-Li, Senior Lifestyles and Leisure Analyst at Mintel. “Marketers would do well to address this trend by including messages of how their food products fit into healthy eating habits, and how the combination of the two can naturally boost one’s mood.”
While, for many, the motivation to eat healthy stems from treating the mind and body right, Mintel research reveals that the motivation to eat well can also come from guilt. Indeed, nearly half (49 percent) of Canadians say they feel guilty when they eat foods they don’t consider healthy, with this number rising to three in five women under age 55 (59 percent) and mothers (60 percent).
In the pursuit of healthy living, real life can often get in the way, with more than one third (35 percent) of Canadians saying their busy lifestyle makes it hard to eat healthy. There also seems to be some confusion when it comes to making healthy choices as two in five (40 percent) agree it is difficult to know which foods are healthy and which are not.
However, while many consumers are actively looking for foods to boost health and wellness, it appears that there is still a ways to go as just one quarter (27 percent) say they are more likely to buy food with a health claim on the package than a similar food without one.
Mintel research indicates that Canadians appear to be mindful of their eating habits as more than three quarters (76 percent) claim to eat healthy all or some of the time. Still, Canadians believe it is okay to indulge every now and then as some 41 percent say they allow a cheat day once in awhile, particularly among women aged 55 and older (51 percent).
“Unsurprisingly, Canadians are faced with a combination of different challenges when trying to make healthy choices on a regular basis, such as time for preparing more whole foods and less processed ones. However, occasional breaks are viewed as acceptable and still a part of a healthy lifestyle, especially among women. For marketers, the focus should therefore be more about balance for younger women, with an emphasis on the notion of rewarding oneself for older women,” concluded Wong-Li.
The Seasonal Appeal
While Americans wait all year in anticipation for their favorite seasonal-inspired food and drinks, new research from Mintel reveals that nearly seven in 10 (67 percent) consumers enjoy being able to consume specific seasonal ingredients year-round. Still, while Americans want the option of seasonal food and drink throughout the year, over three-quarters (78 percent) consider seasonal dishes to be a treat and more than two in five (42 percent) say they are willing to pay more for a seasonal dish when dining out.
Seasonal food and drink ingredients present a welcome opportunity for consumers to extend that special holiday feeling or escape the dreary winter days for sunny summer flavors. Indeed, three in four consumers agree that dining out is a great way to enjoy seasonal flavors, with 70 percent saying that they enjoy the seasonal menu offerings at restaurants. Looking beyond specific dishes, 60 percent of consumers agree that it’s enjoyable when the atmosphere of a restaurant conveys a specific season.
When thinking about seasonal foods, Americans are most likely to consider the flavors and ingredients to be fresh (45 percent). However, seasonal flavors also create an emotional connection with consumers, such as evoking notions of comforting (39 percent), special (39 percent), warmth (33 percent) and happy (30 percent). What’s more, over one quarter (27 percent) of Americans consider seasonal flavors to be nostalgic.
“As Americans associate seasonal flavors with being fresh, special and nostalgic, it seems consumers are less likely to connect seasonal with mass-produced items, but rather items that conjure up an image of being homemade and remind them of personal memories,” said Diana Kelter, Foodservice Analyst at Mintel. “There is an opportunity for restaurants to leverage seasonal claims in more unique ways and build off of the seasonal experience through the presentation and description of their dishes.”
It seems the pumpkin spice latte is here to stay as Mintel research reveals 43 percent of American consumers prefer seeing seasonal ingredients featured in coffee drinks, rising to more than half (53 percent) of Millennials* and 57 percent of iGeneration consumers**. Tea is also becoming a more popular seasonal drink, with one third (34 percent) of consumers claiming they look for seasonal ingredients in tea.
Seasonal flavors aren’t just limited to non-alcoholic beverages, however, as American consumers are also interested in seeing seasonal ingredients featured in beer (27 percent), craft beer (23 percent) and dinner/happy hour cocktails (22 percent). Indeed, the number of cocktails with “seasonal” mentioned in the menu description has increased 34 percent in the last year, according to Mintel Menu Insights.
The iGeneration seem to be trending toward a more shareable dining experience, as iGeneration consumers are the most likely to show a preference toward seasonal appetizers and small plates (50 percent) as compared to just over one third (36 percent) of Baby Boomers. Baby Boomers prefer to see seasonal ingredients in salads (50 percent) as compared to just 41 percent of iGens.
“Seasonal coffee drinks are an affordable indulgence that can add a bit of fun to an everyday routine such as the morning cup of coffee. Younger consumers are a core demographic for seasonal coffee drinks as Millennials have been more exposed to third wave coffee trends, which includes more elevated offerings, artisan preparation methods and increased flavor trends,” concluded Kelter.
Global Coffee Perking Up
The global coffee market continues to brew up a storm and Asia is playing a key role in its growth. New research from Mintel reveals that three out of the five fastest growing retail coffee markets are in Asia. Indonesia is currently the fastest growing packaged retail coffee market with a CAGR of 19.6 percent over the past five years, while India has had a CAGR of 15.1 percent and Vietnam 14.9 percent. Overall, the global coffee market continues to grow steadily, with expected retail volume growth of 2.7 percent in 2016, following a 2.5 percent rise in 2015.
While Asian markets currently make up the majority of the world’s fastest growing coffee markets, European markets, as well as Australia, are among the slowest. Mintel research indicates that Finland’s mature coffee industry declined the most between 2011 and 2016 with a CAGR of -3.7 percent, followed by Australia (0 percent), Poland (0.1 percent), the Netherlands (0.5 percent) and Belgium (0.5 percent).
The boom in Asia’s coffee market has been driven by a surge in innovation of coffee products. According to Mintel’s Global New Products Database (GNPD), between 2011 and 2016 the number of new coffee products launched in Asia has risen by 95 percent. In comparison, the number of tea products launched has risen by a comparatively low 55 percent in the same time period.
Jonny Forsyth, Global Drinks Analyst at Mintel, said: “The global coffee industry continues to experience healthy growth, driven by Asian markets in particular. Asia has far more growth potential as traditionally tea drinking consumers are converted slowly but surely into coffee drinkers. In 2016, there was also an increasing number of coffee launches which blurred the boundaries between coffee and tea. A tea-drinking culture is the biggest barrier to coffee in Asia, and tea-coffee hybrids can be used to tempt consumers.”
Innovation within the coffee space
In terms of local tastes, currently Asia Pacific leads the way in launches of ready-to-drink cold coffee. In 2016, 29 percent of all coffee launches in Asia Pacific were ready-to-drink cold coffee products, compared to just 10 percent in Europe. Additionally, coffee mixes are a huge part of the retail coffee landscape. In the same year, ‘x-in-1’, (i.e. 2-in-1, 3-in-1 or 4-in-1 mixes) accounted for 16 percent of all retail coffee launches in Asia, up from 12 percent in 2014.
However, instant coffee still dominates the retail market in Asia. Two in five (42 percent) coffee launches in Asia Pacific were soluble coffee granule products, compared to just one in five (20 percent) launches in Europe and a mere 6 percent of launches in North America in 2016.
Globally, it is coffee pods which are causing the biggest stir. Pods accounted for over one quarter (26 percent) of all global coffee retail innovation in 2016, up from 11 percent of launches in 2011. Although still in its early stages in Asia Pacific, pod innovation is still showing strong signs of growth in this region. Around one in eight (13 percent) coffee products launched in 2016 was a coffee pod, up from 4 percent of launches in this region in 2011.
“As emerging market consumers develop their taste for coffee, innovation is stepping up a notch as drinkers trade up from instant to fresher-tasting coffee. However, despite increased premiumisation in the global coffee market, the most commodified form of coffee – soluble coffee granules – remains a hugely important segment, especially in Asia. As consumers trade up from instant coffee, pod and capsule sales will increase,” Jonny adds.
Riding the third coffee wave
Moving forward, the humble coffee bean is likely to be receiving a premium makeover. While growth has already been seen in this market, with 15 percent of coffee products launched in Asia in 2016 carrying a premium claim up from 11 percent in 2013, the ‘third wave’ coffee movement is likely to propel this further. As defined by Mintel, the ‘third wave’ coffee movement is taking coffee appreciation a step further, focusing intensely on where beans are sourced and how they are roasted, with a renewed focus on brewing methods.
Currently, America is leading this movement, accounting for over one quarter (27 percent) of all global ‘third wave’ coffee retail launches*. While 16 percent of US consumers describe themselves as ‘coffee snobs’, consumers across Asia are also now showing a developing love for quality coffee. Mintel research reveals that 67 percent of Indonesian metro consumers** believe that the quality of coffee is more important than how easy it is to make, while 22 percent believe they are knowledgeable about coffee and over half (53 percent) say it is important for them to learn more about coffee.
“Most emerging coffee markets remain in the ‘first wave’ of coffee; however, some are starting to enter the ‘second wave’ as foodservice outlets and coffee shops aggressively push Western coffee lifestyles and local coffee shops pick up the baton. Many Asian countries are now making the progression from ‘first wave’ to ‘second wave’, while some nations such as South Korea, Japan, Singapore and Indonesia, are moving towards a ‘third wave’ lifecycle development. Some of the specialty coffee shops in Indonesia, for example, focus exclusively on Indonesian beans to showcase the richness of local coffee. Increasingly, these shops are also serving imported Arabica coffees sourced from around the world, thus enriching the ‘third wave’ coffee scene in the country.” Jonny concluded.
Minnesotans Prefer Healthy
A majority (72 percent) of Minnesotans would be likely to choose healthier food if more options were available in their communities, according to a poll conducted by Blue Cross and Blue Shield of Minnesota (Blue Cross). Nearly 63 percent of respondents also think the state of Minnesota should appropriate funding to increase that access.
According to the poll, most Minnesotans support food access policies that will improve health outcomes and boost local economies. Access to healthy food also was considered to influence where many people choose to live, with 43 percent of respondents citing its importance. Healthy food access was important to more people than access to schools or public transportation.
“Minnesotans clearly understand that not everyone in the state has access to healthy and affordable foods, and they are keenly aware of the benefits it brings to individuals, families and communities,” said Janelle Waldock, vice president, community health and health equity at Blue Cross. “They largely agree that the state of Minnesota should take steps to help support that access.”
Only 36 percent of Minnesotans responding to the poll believe that all state residents have access to healthy and affordable foods. Lack of transportation, poverty, irregular work hours and other barriers make it difficult for thousands to find healthy foods – putting them at greater risk for diabetes, heart disease and other negative health issues.
“Today, over 340,000 Minnesotans face distance and income barriers to obtaining healthy, affordable food — and approximately 235,000 Minnesotans live more than 10 miles from a large grocery store or supermarket,” said Waldock. “The issue of low-access areas is not restricted by geography and exists in both rural and urban areas of the state.” Waldock continued.
Women, millennials and parents express the strongest support for the state of Minnesota taking action to increase food access. Among Minnesota millennial respondents, 72 percent believe the state should take steps to increase access to healthy foods, compared to 63 percent of Generation Xers and 53 percent of baby boomers. More than half (54 percent) of all Minnesotans surveyed would support a state budget commitment of $100 million to support healthy food access for all Minnesotans.
In 2016, Blue Cross supported legislation leading to the creation of the Minnesota Good Food Access program. The program is designed to help more Minnesotans access healthy, affordable foods by providing loans, grants and technical assistance to food providers in underserved locations.
Bipartisan legislation to fund the program was introduced this year and is currently making its way through the Minnesota Legislature. “Convenient access to healthy, affordable food is a serious challenge for many Minnesotans, but it’s a challenge that we are willing to take on and, ultimately, overcome,” Waldock said.
The public-opinion online poll was commissioned by the Center for Prevention at Blue Cross and Blue Shield of Minnesota and conducted by ORC International’s CARAVAN® Geographic Omnibus in December 2016. It consisted of 1,003 adults living in Minnesota. Respondents were 18 years of age and older. The margin of error is +/-3.09 percentage points for the full sample.
Canned Foods Forecast
Shipments of canned foods are forecast to total $56.8 billion in 2021, representing annual growth of 2.0 percent, according to Canned Foods: United States, a report recently released by Freedonia Focus Reports. Advances will stem from population and income growth in domestic and export markets. Increasing levels of disposable personal income will support consumer spending on premium canned goods that offer high-quality food in a convenient format. The food service industry’s reliance on canned food items will represent an additional driver of growth. However, the perception among many consumers that fresh food is healthier than canned food will continue to restrain demand for and corresponding industry production of the latter.
Shipments of canned dressings and sauces are forecast to reach $17.6 billion in 2021, representing annual gains of 1.5 percent. The ubiquity of these products in various meals will support sales. Premium products, including those with organic ingredients, will also help to boost growth.
Another trend expected to drive sales in this segment is the growing popularity of condiments borrowed from or inspired by international cuisine. Instead of traditionally flavored ketchup and mayonnaise, many consumers are opting to accent their food with condiments such as harissa, gochujang, sambal oelek, and sriracha. Once largely relegated to specialty stores, many of these products are now broadly available for purchase in mainstream retail outlets and as a condiment choice in restaurants.
St. Patrick’s Spending Up
Americans will spend more than ever as they put on their favorite green outfits to celebrate St. Patrick’s Day this year, the National Retail Federation said. According to NRF’s annual survey conducted by Prosper Insights & Analytics, spending for St. Patrick’s Day is expected to reach $5.3 billion, an all-time high in the survey’s 13-year history.
More than 139 million Americans plan to celebrate the Irish holiday, and are expected to spend an average of $37.92 per person, up from last year’s $35.37 and a new record that tops the previous record of $36.52 set in 2015. The $5.3 billion total is up dramatically from last year’s $4.4 billion and tops the previous record of $4.8 billion set in 2014.
“Now that winter is almost behind us and with St. Patrick’s Day falling on a Friday, we will see more Americans getting together to celebrate with friends and family,” NRF President and CEO Matthew Shay said. “Retailers should expect a nice boost in sales as consumers purchase apparel, decorations, food and beverages to help make their celebrations special.”
According to the survey, 83 percent of celebrants will wear green to show their Irish pride, 31 percent plan to make a special dinner and 27 percent will head to a party at a bar or restaurant. Twenty-three percent will decorate their homes or offices in an Irish theme and 15 percent will attend a private party. In addition, 15 percent are planning to attend a St. Patrick’s Day parade, especially those living in the Northeast (21 percent).
The survey found that 52 percent of celebrants will purchase food, 41 percent beverages, 28 percent apparel or accessories, 22 percent decorations and 14 percent buy candy. Of those making purchases, 39 percent will go to grocery stores, 29 percent to discount stores, 21 percent to bars/restaurants and 18 percent to department stores.
“St. Patrick’s Day is a time for consumers of all ages to have fun and celebrate all things Irish whether it is attending a parade, cooking an Irish meal, or meeting friends at a bar or restaurant,” Prosper Insights Principal Analyst Pam Goodfellow said. “While more Americans are planning to celebrate the shamrock-filled day, expect Millennials to take the lead among the festivities.”
The holiday is most popular among individuals 18-24 years old, with 77 percent celebrating, but those 25-34 will be the biggest spenders at an average $46.55.
The survey, which asked 7,609 consumers about their St. Patrick’s Day plans, was conducted February 1-8 and has a margin of error of plus or minus 1.1 percentage points.
Brits and Alcohol
While the majority of Brits enjoy a tipple, it seems today’s consumers are taking a more conservative approach towards their alcohol consumption. Indeed, new research from Mintel reveals that as many as one third (32 percent) of all Brits have reduced or limited their alcohol intake over the past 12 months* in comparison to what they would usually consume. What is more, half (51 percent) of the nation’s beer, wine and cider drinkers say they are drinking less alcohol than a few years ago, confirming Brits are actively moderating their drinking habits.
While many glasses may now be half empty, it is economical factors which are encouraging consumers to cut back. Over two in four (44 percent) Brits who have reduced their alcohol have done so in order to save money, while 41 percent of those choosing to limit alcohol intake have done so to lose or avoid gaining weight. Improving personal health (39 percent) is also a notable trigger for cutting down and a further 30 percent have cut-back to reduce the risk of disease. Additionally, some 14 percent of all those who have cut back on alcohol have done so because they are worried about becoming dependent on alcohol and the same proportion (14 percent) have cut back to stay within current NHS and government guidelines.
The consumers most likely to have cut back at some point are those aged 25-34 (35 percent) and 35-44 (36 percent); meanwhile, geographically this peaks at 41 percent in the North East and dips to 27 percent in the South East/East Anglia.
Today, one fifth (19 percent) of adults report they do not drink alcohol, with a slightly higher proportion of women (22 percent) than men (17 percent) being teetotal.
Richard Caines, Senior Food & Drink Analyst at Mintel, said: “As many as a third of all Brits have limited or reduced their alcohol consumption at some point in the last year. While this includes consumers cutting back for shorter and longer periods of time, it is a strong indicator that steps to moderate alcohol consumption are now widespread. Reducing alcohol consumption to save money reflects the discretionary nature of drinks and how they can add significantly to outgoings.”
The fact that Brits are reducing the amount of alcohol they drink presents a significant opportunity for low-alcohol and alcohol-free beers, ciders and wines. Today, lower-alcohol beer, cider or wine is drunk by around one quarter (23 percent) of alcohol drinkers, while overall, just 14 percent of Brits drink non-alcoholic or alcohol-free beer, cider or wine. Usage of lower-alcohol drinks is higher among men (26 percent) and significantly above average for 18-34-year-olds (41 percent).
Pubs and bars are proving popular venues for low alcohol brands, as a night out (26 percent) and a casual drink at the pub (22 percent) are when low-alcohol drinks most appeal to consumers if they are limiting or reducing their alcohol intake.
A taste more like standard-strength equivalents would sway nearly three in 10 drinkers (28 percent) to consume low-alcohol or alcohol-free versions of alcoholic drinks. However, overall, soft drinks are more popular than low-alcohol, alcohol-free versions of alcoholic drinks for all occasions. For current alcohol drinkers, 41 percent say that if they were limiting the amount of alcohol they were drinking when having a casual drink at the pub then they’d pick a soft drink, compared to 29 percent who would pick a low-alcohol or non-alcoholic version of an alcoholic drink.
“Replicating the taste of standard-strength alcoholic drinks and changing perceptions remains a key challenge for low-alcohol and alcohol-free manufacturers. Alcohol-free versions of alcoholic drink brands also need to look at the reasons why consumers are limiting or reducing their alcohol intake in order to increase their appeal as an alternative to standard-strength alcoholic drinks. This includes offering bigger savings to those looking to save money, as well as prominently highlighting lower calorie content compared to standard-strength equivalents to those looking to better manage their weight and improve their health.” Richard adds.
Finally, Mintel research reveals that weekly alcohol limits are a mystery for most Brits. Introduced in January, new guidelines on alcohol advise men and women to drink no more than 14 units of alcohol per week on a regular basis. However, when asked how many units of alcohol per week the current NHS and government guidelines advise for men and women, Mintel research indicates that only one in 10 (10 percent) adults correctly stated the 14 units a week recommended and more than four in 10 (42 percent) admitted that they didn’t know.
“While consumers are aware of the health dangers from drinking too much alcohol, few are clear on the limits advised in the new guidelines to keep health risks low. Low-alcohol drinks brands could benefit from driving awareness of these limits and what the number of units in individual drinks means in terms of their contribution to that weekly guidance. Doing so could help to encourage more switching over to low-alcohol products from higher-alcohol drinks.” Richard concludes.
Europe is Center of Global Wine Industry
While the first known wine production occurred in the Middle East more than 6,000 years ago, Europe has been the center of the global wine industry for many centuries. Although wine production occurs in several dozen countries and on all inhabited continents, Europe remains the leading wine producing and consuming region by a wide margin. The region accounted for more than 60 percent of global wine production and consumption in 2015, while accounting for less than 10 percent of the world’s population. Wine consumption in Europe is projected to increase slightly to 15.2 billion liters in 2020. These and other trends are presented in World Wine Packaging: Containers, Closures, & Accessories, a new study from The Freedonia Group.
Demand for wine packaging in Europe is projected to increase 2.0 percent to $15.8 billion in 2020. Europe is by far the largest regional wine packaging market, although its share of the global market is expected to continue to slide gradually.
Europe’s wine packaging market is remarkably diverse. It includes several countries (e.g., France, Italy and Spain) in which wine is a significant part of national economic output, as well as an inextricable part of everyday life. For these countries, the wine packaging market is multifaceted, with domestic markets generally receptive to alternative packaging formats. However, their wine packaging for export markets usually conforms to more traditional expectations. All three countries, also export wine in bulk.
Buying Alcohol Online
Whether we are toasting a friend’s engagement, tossing one back at a party, or just relaxing at home with a drink at dinner or while watching TV, Americans rarely run out of excuses to partake in alcohol. With so many reasons to sip, chug, or shoot, it should come as no surprise that nearly 7 in 10 Americans aged 21 and over (68 percent) are “regular buyers” of alcohol (purchase any type of alcohol, either for themselves or for someone else, at least several times per year).
Interestingly enough, nearly 1 in 10 adults 21+ (8 percent), or 12 percent of regular adult beverage buyers, say they purchased at least some of their alcohol online in the past 6 months. Among those regular buyers of alcohol who bought alcohol online at least once during the past six months, the percentage purchased online vs. in-store was highest for wine (42 percent), with beer (29 percent) and spirits (35 percent) trailing.
These are some of the results of The Harris Poll® of 2,060 U.S. adults aged 21+ surveyed online between November 9 and 11, 2016. Of those interviewed, 1,359 were “regular buyers,” including 155 who had purchased alcohol online in the past six months (“online buyers”).
Who buys alcohol online?
Compared to regular buyers who only purchase alcohol in-store (“in-store only buyers”), online buyers tend to be higher-earning, younger, male, married, and employed full-time.
The present and future of online alcohol purchasing
Thinking about their most recent online alcohol purchase, nearly half of online buyers (48 percent) said their plan was to consume their purchase within that week, while 1 in 4 (25 percent) planned to consume (or start to consume) their purchase the day they received it.
Though they may buy online, half (50 percent) of online buyers receive the alcohol they purchased by going and picking it up at a store – about 2 in 5 (41 percent) get it delivered within hours, 1 in 3 (34 percent) say it gets delivered within 1-2 days, and more than 1 in 4 (27 percent) receive the delivery more than 2 days from purchase.
A significant proportion of online buyers – especially online buyers of wine – expect the amount of alcohol they purchase online to increase in the next year, while 11 percent of in-store only buyers say they are planning to give online purchasing a try in the upcoming year.
“While online purchasing of alcohol may be lagging that of other categories today, we expect it will continue to grow rapidly as more e-commerce channels are made available and online barriers are overcome, and as consumers become more accustomed to buying their alcohol online, especially to suit various consumption occasions,” said Danny Brager, SVP of Nielsen’s Beverage Alcohol Practice.
This Harris Poll was conducted online, in English, within the United States between November 9 and 11, 2016 among 2,060 adults aged 21+.
Bottled Water is King
Bottled water effectively reshaped the beverage marketplace.
Capping a remarkable, decades-long streak of vigorous growth, bottled water passed a major milestone in 2016, when it surpassed carbonated soft drinks to become the largest beverage category by volume in the United States. Total bottled water volume grew from 11.8 billion gallons in 2015 to 12.8 billion gallons in 2016, an increase of nearly 9 percent, which marked the third year in a row of accelerating growth.
“Bottled water effectively reshaped the beverage marketplace,” said Michael C. Bellas, chairman and CEO, Beverage Marketing Corporation. “When Perrier first entered the country in the 1970s, few would have predicted the heights to which bottled water would eventually climb. Where once it would have been unimaginable to see Americans walking down the street carrying plastic bottles of water, or driving around with them in their cars’ cup holders, now that’s the norm,” he added.
With the exception of two relatively small declines in 2008 and 2009 – when most beverage categories contracted – bottled water volume grew every year from 1977 to 2016. This period included 17 double-digit annual volume growth spurts. Since resuming growth in 2010, bottled water volume has consistently enlarged at solid single-digit percentage rates. As a result, per capita consumption exceeded 39 gallons in 2016, while average intake of carbonated soft drinks slipped to about 38.5 gallons. Around the turn of the century, per capita soft drink consumption regularly exceeded 50 gallons, and Beverage Marketing expects bottled water to reach that level by the middle of the next decade.
The comparison of the two largest beverage types is illustrative. Bottled water’s ascent coincided with and encouraged seismic shifts in consumer preferences for healthier refreshment and rehydration. As the ultimate portable and affordable beverage, bottled water spawned new usage occasions and habits. Suitable for consumption at any and all times of day, and not necessarily in need of being kept ice cold, or carbonated, bottled water simply became the preferred beverage not only for consumers aiming to cut back on calories or artificial sweeteners but also for consumers of all kinds wanting to consume a healthy all-natural refreshment beverages.
Single-serving sizes of those bottles became the most popular option, driving overall growth of the category and accounting for the majority of its volume. In 2016, the single-serve segment enlarged by more than 9 percent to reach 8.6 billion gallons. Yet all other segments, including larger, multi-serving bottles as well as home and office delivery, sparkling water and imports, also registered growth in 2016. Indeed, both domestic sparking and imports advanced at double-digit rates, albeit from comparatively small bases.
Looking forward, Beverage Marketing expects bottled water to continue building on its already monumental history of enlargement and putting still more distance between itself and the beverage category it surpassed.
Keep it Spicy
Technavio analysts forecast the global spices and seasonings market to grow at a CAGR of above 5 percent during the forecast period, according to their latest report.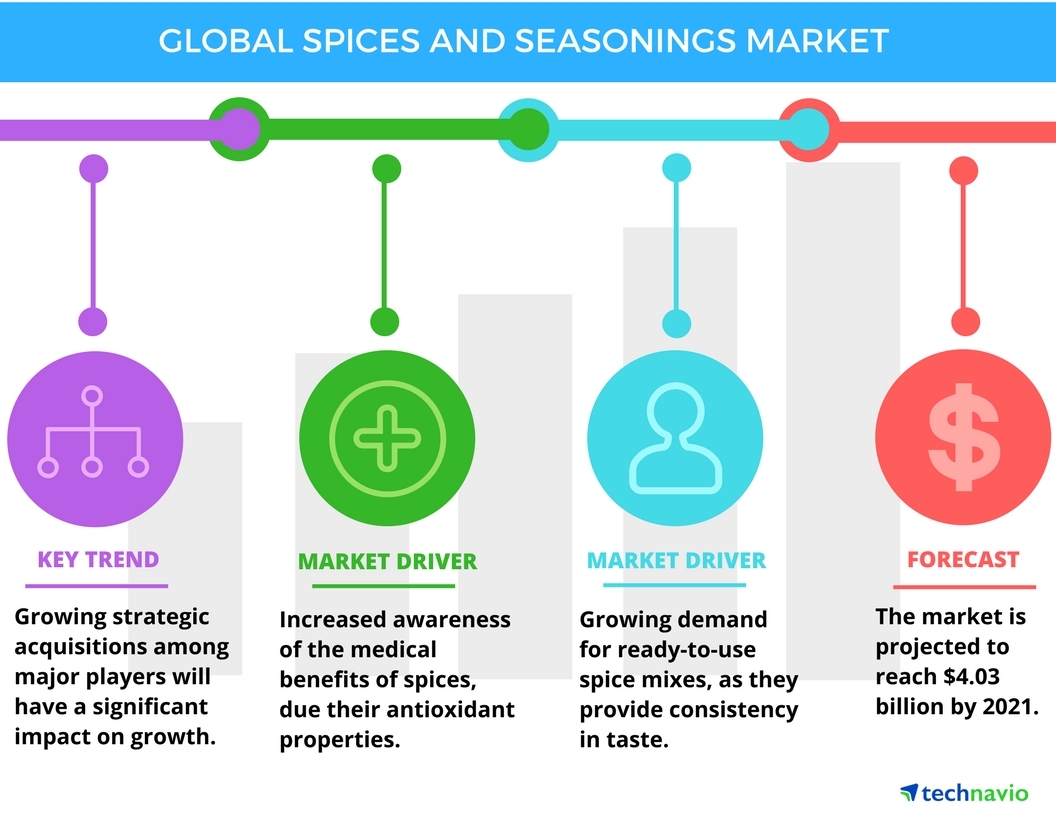
The research study covers the present scenario and growth prospects of the global spices and seasonings market for 2017-2021. The report analyses the market potential for each product based on the growth rate, macroeconomic parameters, consumer buying patterns, and market demand and supply scenario.
The market is expected to grow moderately during the forecast period because of the increased use of various spices in food preparation, interest in new flavors, growing importance of different spices and herbs for different medicinal properties, and increasing demand for ethnic foods by consumers. However, the rising prices of spices because of gaps in supply and demand and different import as well as export regulations across countries can hinder the growth of this market during the forecast period.
Technavio food and beverage analysts highlight the following three factors that are contributing to the growth of the global spices and seasonings market:
Growing awareness of the medical benefits of spices
Spices today are not just used for taste and flavor but also for the health benefits they possess. They have antioxidant properties and are thus, used in food to treat health problems or diseases. For instance, turmeric is rich in antioxidants and helps in fighting against diseases such as Alzheimer’s, cancer, and joint inflammation. Cumin seeds have antiseptic qualities and help in building the immune system. They can be used as substitutes even for beauty products and medicines. Black pepper powder is also used to make medicines. It often used to cure stomach upset, bronchitis, and cancer.
Manjunath Reddy, a lead food research analyst at Technavio, said, “Seasoning and spice companies have also started new advertising campaigns to encourage consumers to try recipes at home. Companies like McCormick and Kerry have also started campaigns on social media such as Facebook, Pinterest, and Twitter to help establish their brands’ identities.”
Rising popularity of ethnic cuisines
Consumer willingness to experiment with new flavors and widespread interest in new ethnic tastes has led to a proliferation of product offerings and growth in the sales of seasonings and spices. In developed economies like the US and European countries, Japanese restaurants, which are characterized by their emphasis on light seasoning and natural flavors, have witnessed strong growth.
“A rise in demand for authentic ingredients and a fusion of ethnic flavors is driving the market. For instance, a few of the important herbs used in Latin cooking by Hispanics such as cilantro, jalapeno, chipotle, cinnamon, paprika, and cumin, are gaining popularity,” added Manjunath.
Growing demand for ready-to-use spice mixes
Ready-to-use spice mixes are becoming increasingly popular among consumers as they save time and effort and provide consistency in taste every time a particular dish is prepared. The hectic lifestyles of consumers, growing demand for convenience in food preparation, and increasing disposable incomes have led to an increase in the demand for ready-to-use spice mixes.
Edible Packaging to Rise
The presence of only a few players, namely, MonoSol, LLC, WikiCell Designs Inc., JRF Technology LLC, and Tate and Lyle Plc., in the global market for edible packaging reveals its consolidated structure, states a new report by Transparency Market Research (TMR). The market is highly competitive at present and is anticipated to remain so over the next few years.
As per the research report, the global edible packaging market, which offered an opportunity worth US$0.77 bn in 2016, is expected to rise at a CAGR of 6.90 percent during the period from 2016 to 2024, attaining a value of US$1.3 bn by the end of the forecast period. The food and beverage manufacturing segment has acquired the leading position in this market and is anticipated to remain highly attractive throughout the period of forecast.
Market for Edible Packaging to Remain Strong in North America
According to the report, North America, Asia Pacific, Latin America, Europe, and the Middle East and Africa are the prime geographical segments of the worldwide edible packaging market. It further present a regional analysis of this market on the basis of its performance in each of these regions. Among these, North America has emerged as the leading regional market for edible packaging, thanks to the U.S. being both, a prominent producer and consumer of edible packaging, across the world. The North America market for edible packaging held a share of more than 36 percent in 2016. The regional market is projected to remain on the top of the global market by the end of the forecast period, although with a slight decline in its share, which is attributed to its maturing state.
On the other hand, Asia Pacific is anticipated to offer a highly lucrative market to players in the near future, thanks to the rising awareness level of consumers regarding the benefits of edible packaging and the increase in their disposable income, which is impacting positively on their standard of living, fueling the demand for edible packaging in this region.
Urbanization and Changing Standard of Living to Have Great Influence on Demand
“The rising consumption of processed products, increasing household income, and the growing preference for hygienic and durable products among consumers have surfaced as the main driving force behind the growth of the global edible packaging market,” says an analyst at TMR. The upswing in urbanization in emerging economies is another important factor that is pushing this market to grow steadily.
In addition to this, the rising awareness among consumers about the attributes of edible packaging, such as the easy handling of products despite maintaining their quality and the shelf life is likely to propel this market substantially in the near future. However, the high cost associated with the packaging machines and quality films utilized in edible packaging may hamper the smooth sailing of this market, in the years to come. Apart from this, the escalating usage of modified atmosphere packaging may also limit the market’s growth to some extent in the near future, notes the study.
Food Storage Trends
Technavio’s latest report on the global food storage container market in the US provides an analysis on the most important trends expected to impact the market outlook from 2017-2021. Technavio defines an emerging trend as a factor that has the potential to significantly impact the market and contribute to its growth or decline.
Manu Gupta, a lead research analyst from Technavio said, “Food storage container manufacturers in the US are increasing investments in R&D to offer the best designs and materials. They are also focusing on improving the quality of the products, keeping in mind environmental and sustainability concerns. End-users are also looking for diversification for the uses of food storage containers.”
Many end-users such as large restaurants prefer to prepare and store food in large quantities to improve their production efficiency. This necessitates the use of food storage containers, which helps save time and cost for end-users. It is equally important for end-users to choose the most durable food storage containers so that they can withstand extreme temperature. Durable containers can help them avoid frequent replacements.
The top three emerging trends driving the food storage container market in the U.S. according to Technavio research analysts are:
Rising importance of sustainable containers
Chefs and restaurateurs have identified that customers appreciate the use of sustainable practices when dining out. To continue as a sustainable business, restaurants are trying to reduce their food waste and are beginning to cut down on their energy use. Consumers prefer containers that are environment-friendly. Vendors are increasingly investing in R&D to develop containers that are recyclable and resistant to friction, moisture, and heat.
“Manufacturers are focusing on incorporating innovative technology to provide versatile materials that are durable, eco-friendly, and temperature-resistant. They can be used as insulated storage containers and are also beneficial for different end-users,” according to Manu.
Demand for more sophisticated design
Many leading manufacturers are finding new sources of cost saving. This will help them optimize product formulations by implementing efficient equipment. Therefore, top vendors are looking for new cost saving mechanisms and more sophisticated designs to increase the efficiency of different products. This will provide them with opportunities to escalate profit and attain their sustainability goals.
Currently, many food storage container manufacturers are providing a wide range of containers, which are efficient and require very little maintenance. Increased demand for plastic-based food storage containers among consumers and buyers is propelling market growth.
Rise in demand for glass containers
Glass storage containers generally have a plastic lid that helps in keeping the food airtight. These containers are available in clear, frosted, and colored glasses. There are several advantages of glass containers such as longevity and they keep the food fresh for longer periods as compared with other food storage containers. Many end-users prefer glass containers, which are specifically designed for use in freezing and preheating purposes.
There are manufactures that are providing different kinds of improved versions of glass food storage containers like the tempered glass and Pyrex, which are widely used in commercial kitchens. Some of these containers are manufactured to be used in microwaves without causing any cracks. Glass food storage containers do not stain, peel, or take on the taste or odor of the food stored in them.
Small Businesses and Social Media
A significant number of small- to medium-sized businesses have not yet adopted social media. In a recent survey of small business owners/managers, 24 percent said they currently don’t use social media for their business, while eight percent don’t ever expect to use social media.
The survey was conducted by Clutch, a leading B2B ratings and reviews firm, to gauge digital marketing habits and goals for small businesses in 2017. The series includes reports on mobile apps, web design, and more.
Social media marketing experts suggest that businesses not yet using social media should reconsider.
“Many [small business owners] read the headlines from five to six years ago about ‘likes’ not mattering and bought into that,” said Joshua Dirks, CEO of Project Bionic, a Seattle-based creative marketing agency. “They are missing out because of their own viewpoint on the topic, [made] from believing five- to six-year-old headlines and not recapturing the maturation of the space.”
Experts also emphasized the benefits of social media marketing over traditional marketing channels.
“Social is one of the few forms that allows you to look at the data,” said Keith Kakadia, Founder and CEO of Sociallyin, a Mississippi-based social media agency. “It allows you to determine whether there’s a return on investment (ROI) for the money spent. When you have a small budget, every single dollar needs to be spent on what works.”
Facebook is by far the most popular social media platform for small businesses. The survey found that over 90 percent of small businesses with a social media presence use Facebook. The second most popular channel, Twitter, is used by 55 percent of small businesses.
“In general, Facebook is a beast. Its reach is incredibly vast, with almost 2 billion users,” said Alex Oesterle, owner of Blue Bear Creative, a Denver-based social media agency. “No matter what a business does, its customers are likely on Facebook, at least in part.”
Over half of small businesses that already use social media indicate that they want to increase investment in Twitter, Instagram, and YouTube respectively in 2017.
Each channel has its benefits, according to social media experts interviewed about the survey findings. Twitter faces an uncertain future, however, and YouTube requires making sometimes costly and time-intensive videos. Instagram, with over 600 million users in the United States, may be the best option for small businesses to explore, said Dirks.
Over half of small businesses currently use in-house staff for their social media marketing. A little over one-third use either a freelancer/consultant or social media management software.
Experts cite the importance of placing someone knowledgeable in charge of social media. “One thing we hate to see is handing social media off to an intern or a freelancer with no knowledge of branding or strategy,” said Oesterle. “It makes for lackluster results and perpetuates the cycle of cutting social media costs.”
Clutch’s 2017 Small Business Digital Marketing Survey included 350 small business owners/managers: 40 percent of companies had 10 or fewer employees, 27 percent had 11-50 employees, 25 percent had 51-250 employees, and 8 percent had 251-500 employees.
Rise of Drones
From package delivery to props in major sporting events, drones continue to play major roles in everyday life. But are enterprises prepared for “The Rise of the Drones” in their operations? That’s the focus of a new white paper and global survey available now from global technology association ISACA.
“The Rise of the Drones” outlines some of the potential uses of drone technology in a commercial environment, including business implications and risk considerations, as well as critical questions an enterprise must consider prior to implementing a drone program:
What factors must management consider prior to signing off on the acquisition and implementation of a corporate drone program?
What questions must be asked and answers obtained to enable management to assess the far-ranging risks associated with the use of drones as a strategic business tool?
What policies and procedures must be in place before the organization deploys its first corporate drone?
This white paper addresses these questions and more, with the intent of preparing management for the inevitable. If an organization wishes to remain competitive in today’s global marketplace, it will eventually look to drones (and their related technologies) as a competitive tool and embrace all that drone technologies have to offer.
Along with the paper, ISACA polled its global membership to gauge the use of and planning for drones in their respective organizations. Among the findings of that survey:
- 75 percent say security or privacy are their biggest concern about the business use of drones.
- 65 percent say most organizations that would benefit from the use of drones are unprepared to address the necessary security and privacy requirements.
- 63 percent do not believe their existing staff has sufficient expertise to evaluate the security of drones.
- Just 25 percent believe the benefits of drones outweigh the security and privacy risks—but an additional 48 percent say the benefits will outweigh the risks in the future, when those concerns are addressed more thoroughly.
“Rushing to implement drone technology without first being properly prepared can result in both a legal and financial disaster. An uncontrolled drone program can also cause significant damage to the organization’s reputation,” said Albert Marcella, Ph.D., CISA, CISM, author of the ISACA paper. “However, with the right controls, policies and procedures in place, a drone program can offer significant technical and competitive advantage.”