
According to a Recent Study/Survey … Special Delivery (Infographic)
7 Min Read By MRM Staff
Sometimes information comes across the news desk at Modern Restaurant Management magazine that’s too good to not share right away. In this special delivery of “According to a recent study/survey…,” we have data insights on the influence of third-party delivery apps, digital ordering preferences and customer satisfaction levels with full-service restaurants.
Third-Party Influence
Sense360 released its new report, Impact of Third Party Delivery Apps on Restaurant Visits, which found no significant decrease in restaurant visits and in-store orders from customers who have downloaded third-party delivery apps. The findings come as the topic of third-party delivery continues to gain attention from restaurant operators and investors alike, who have questioned whether partnering with an outside delivery service could cannibalize in-restaurant orders and potentially cause a negative impact on same store sales.
Sense360 tracked over 21 million anonymous FSR and QSR visits to measure visit frequency both before and after downloading third-party delivery apps such as UberEats, GrubHub and Postmates and found there is no evidence that delivery apps drive significant, short-term drops in visitation. In one example, upon analysis of McDonald’s customers who downloaded the UberEats app during the brand’s delivery test pilot in participating Florida DMAs, Sense360 found that McDonald’s did not experience any noticeable visitation decrease among the UberEats users.
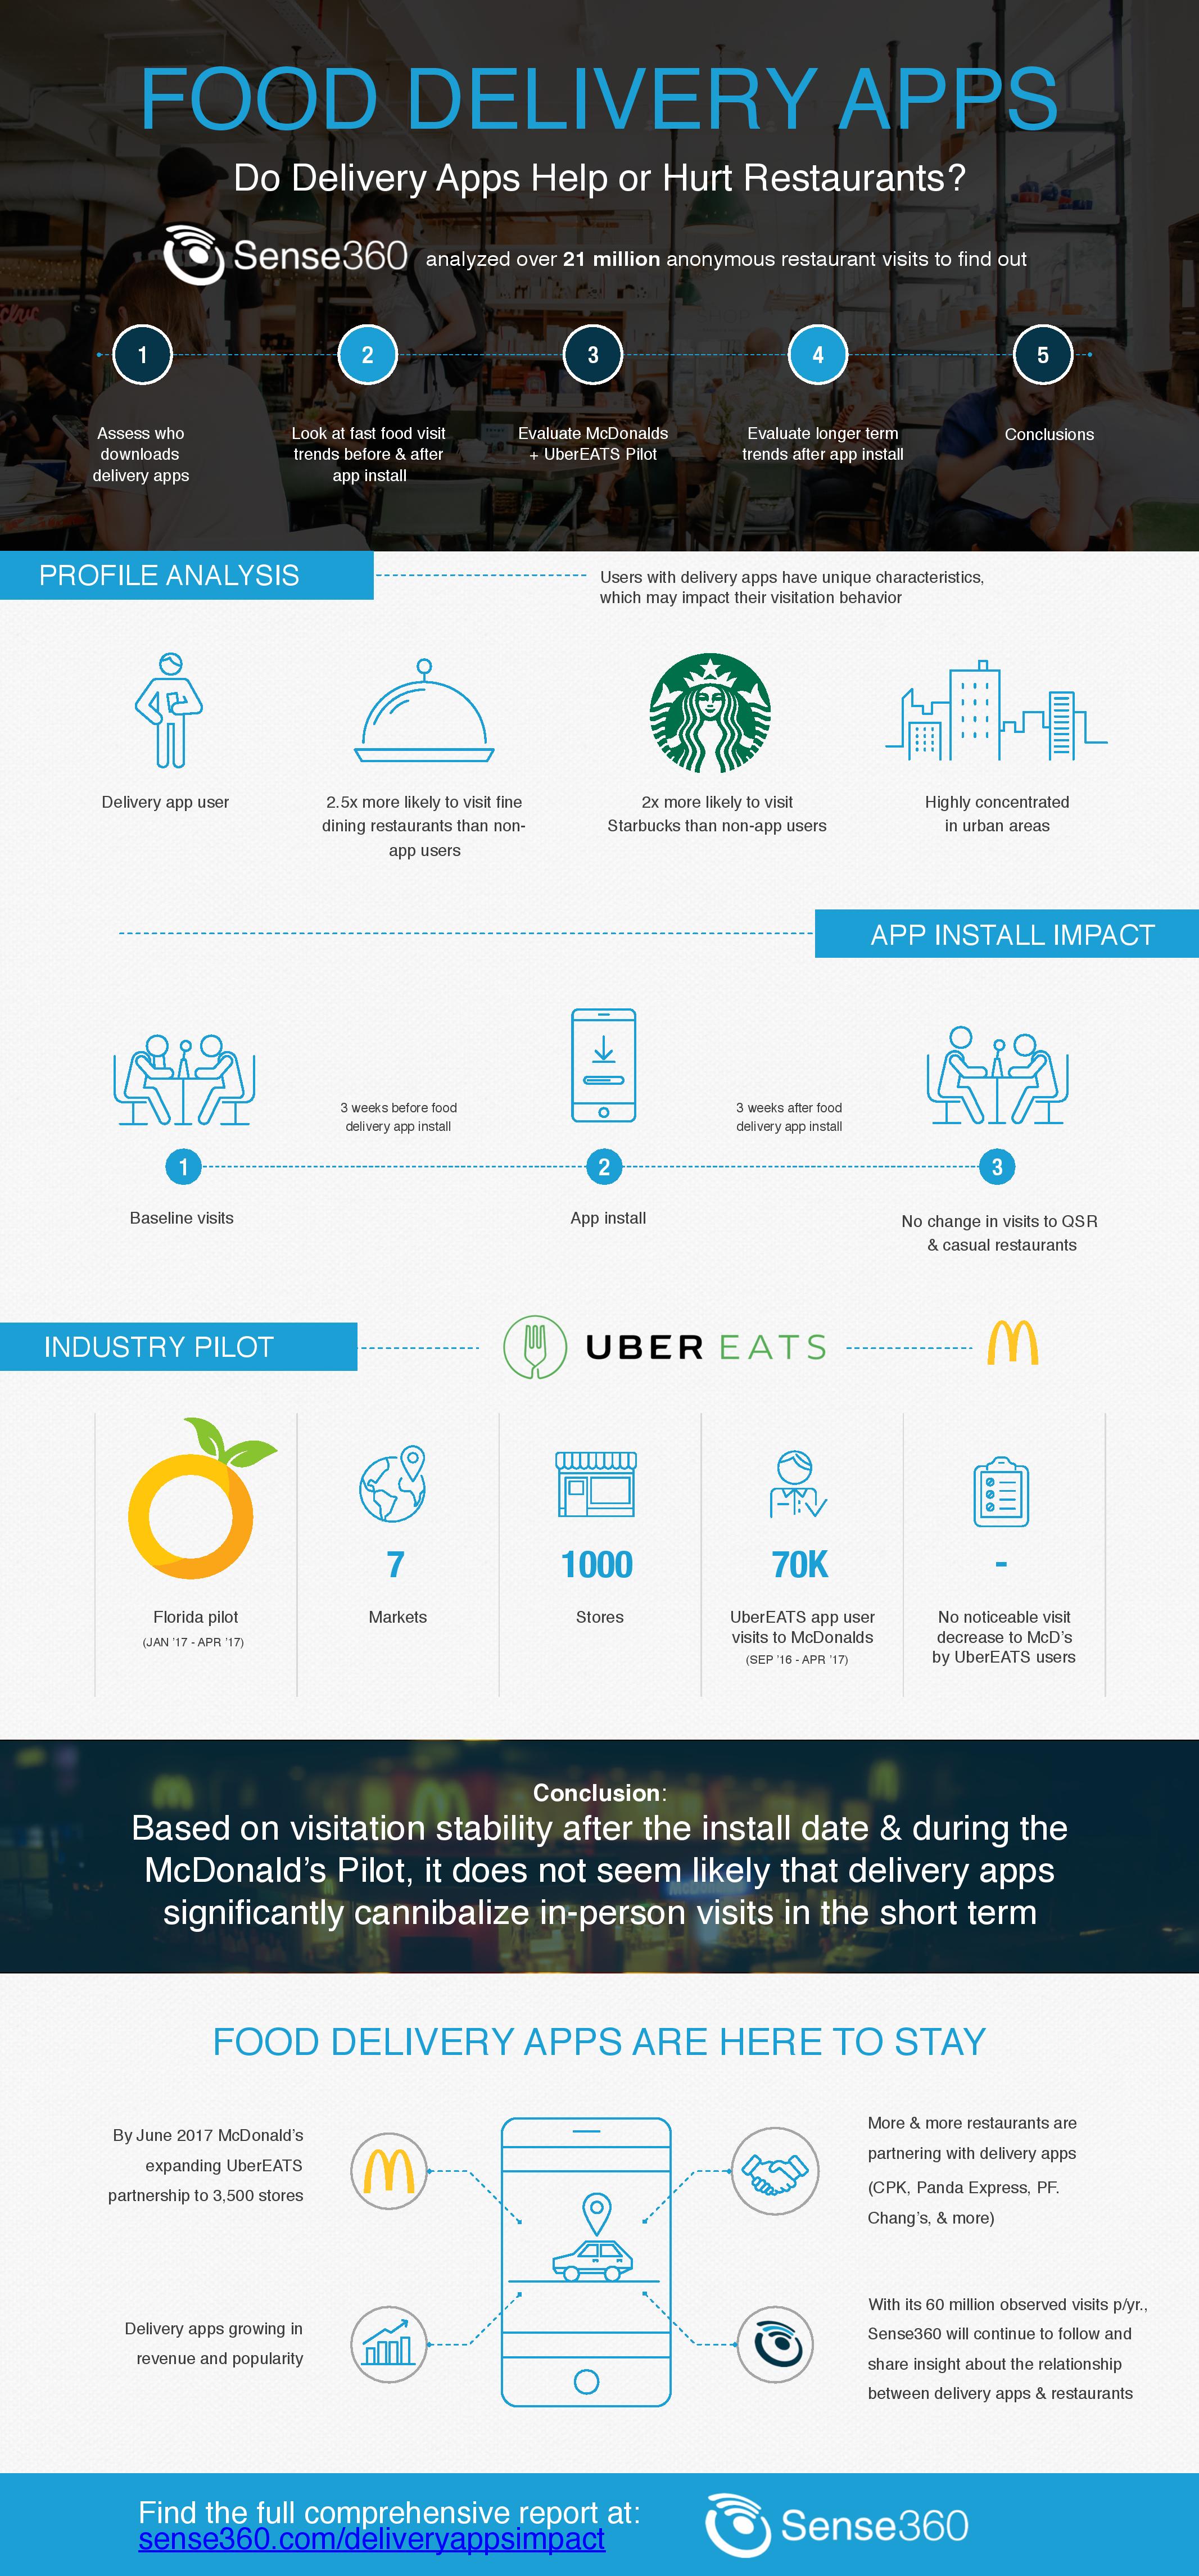
“With delivery among the most watched business opportunities in the restaurant industry today, our findings tell an interesting story of both who delivery app users are and that downloading such apps did not impact their in-restaurant visit behaviors and frequency,” said Eli Portnoy, CEO and Founder of Sense360. “The data gives a clear and unequivocal view into this industry trend and provides clarity that restaurant operators and owners have been seeking to help them make the most informed and strategic business decisions.”
In fact, the company found that the unique visitation patterns of delivery app users are most often driven by extrinsic characteristics, such as geographic locations, persona and socioeconomic characteristics, more than the apps themselves. For instance, people with delivery apps installed on their phones are more likely to live in top metro areas such as New York, San Francisco, and Los Angeles. They tend to be of higher income, and visit fine dining restaurants two-and-half times more frequently, as well as slightly more visits to grocery stores, than consumers who do not use delivery apps.
Key findings of the Sense360 Report include:
- No significant short-term change in restaurant visit frequency among customers after they have installed a third party delivery app.
- Consumers with delivery apps installed on their phone go out to QSR and Fast Casual Restaurants five percent less than people without delivery apps.
- Delivery apps are more popular and oft-used by consumers in top metro areas including New York, San Francisco and Los Angeles.
- Those who download delivery apps tend to be of higher income, and visit fine dining restaurants two-and-half times more frequently than those without a delivery app.
- Delivery app users who frequent QSRs tend to visit newer and higher-priced concepts such as Chipotle and Starbucks more often than traditional quick-serve locations such as McDonalds or Hardees.
“It’s important to consider all the factors that come into play,” continued Portnoy. “If delivery apps caused lower visitation rates, then they could indicate cannibalization of in-store visits. However, if delivery apps merely indicate a different type of user, according to socioeconomic level, demographic or geography, who has a naturally lower rate of visitation, then creating opportunity for them to access the brand on a delivery app could drive incremental purchases.”
For this study, Sense360 tracked 21 million QSR and Fast Casual Visits from June 2016 through April 2017, including 1.1 million visits from users with delivery apps installed. To access the complete Impact of Third Party Delivery Apps on Restaurant Visits report, click here.
Digital Ordering Trends
orderTalk, Inc. released the results of a new online survey conducted on its behalf by Harris Poll in April 2017 among 2,246 U.S. adults shedding insights into consumer behavior and preferences in the U.S. when ordering food online.
Overall, the survey found that many American consumers who have ordered takeout digitally (i.e., via an app/website) prefer ordering takeout digitally, but would like digital ordering interactions to be easier.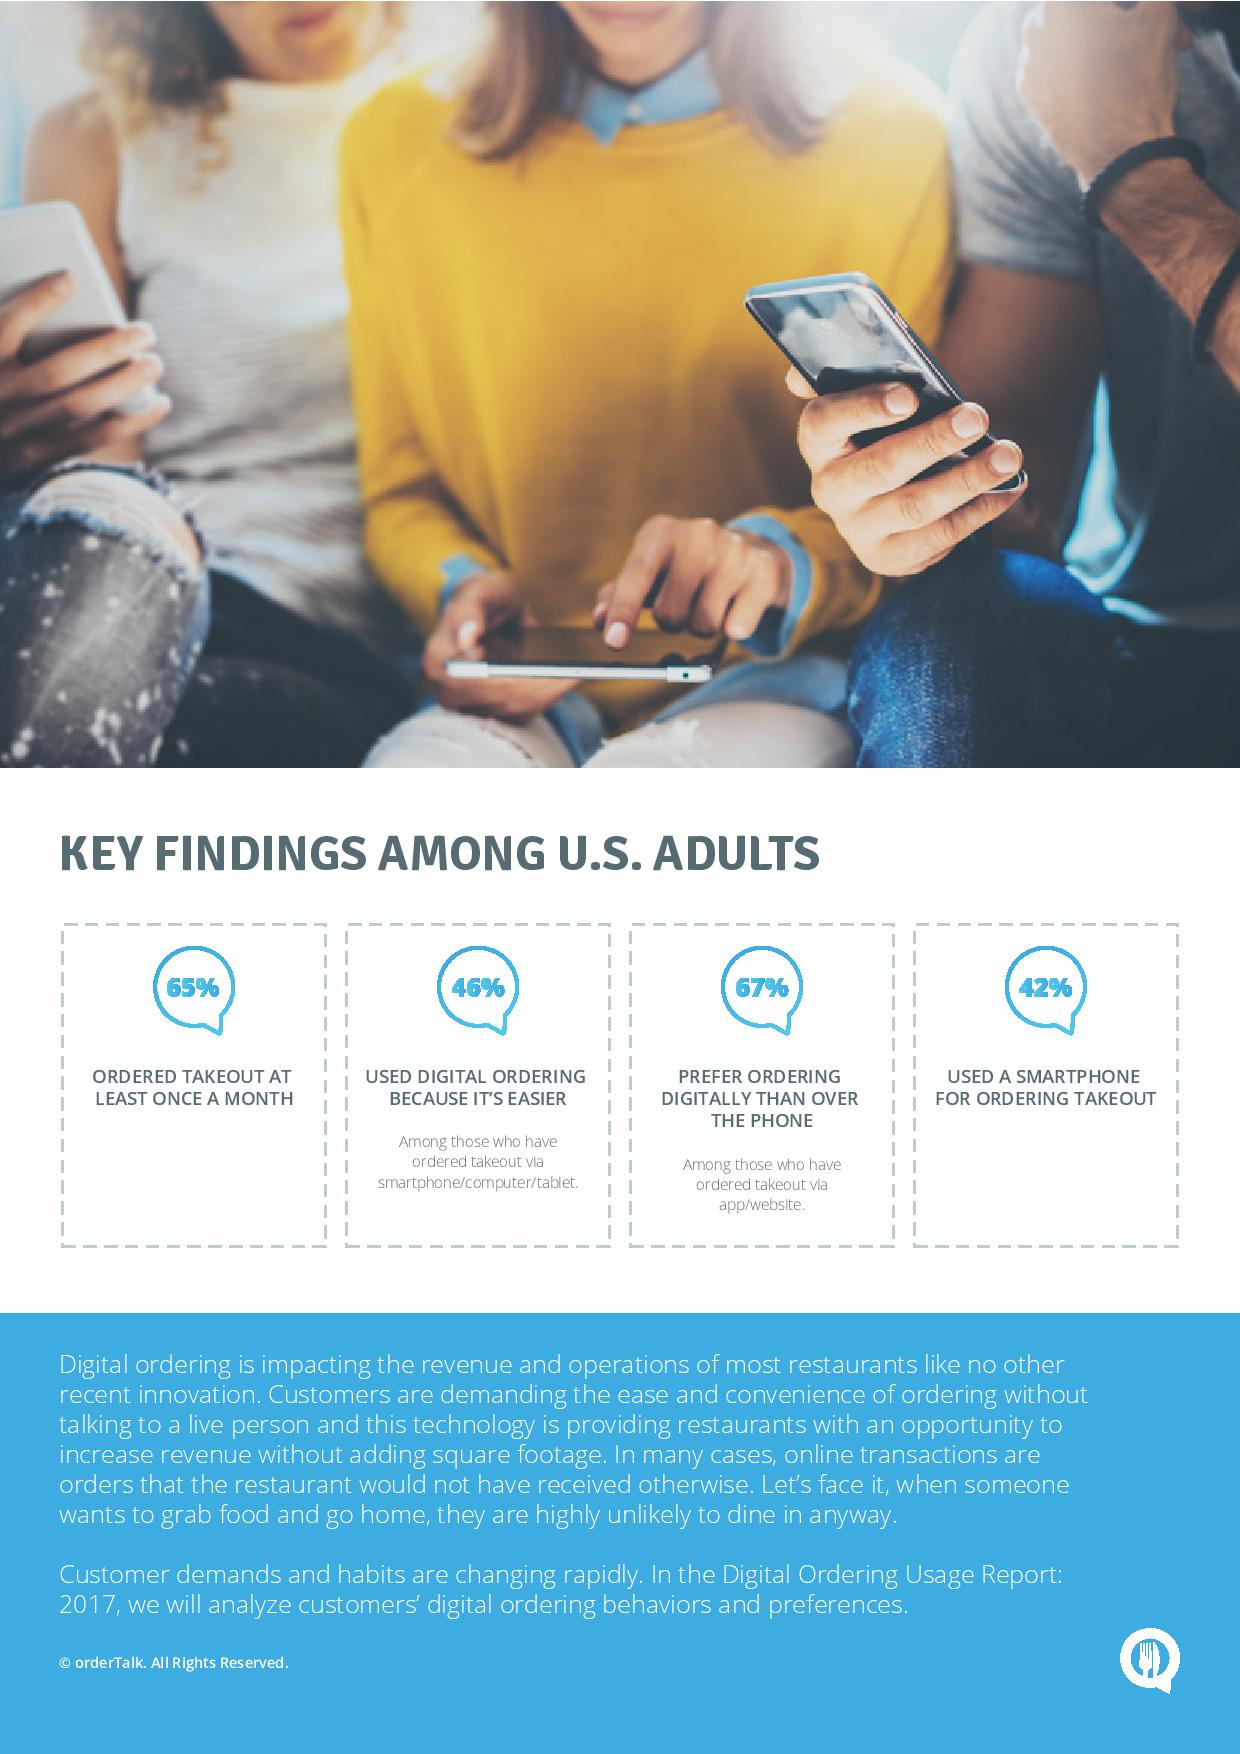
“Digital ordering has impacted the revenue and operations of most restaurants like no other recent innovation,” said Patrick Eldon, CEO of orderTalk, Inc. “It also continues to reshape consumer expectations and demands, which is why we need to keep a watchful eye on what Americans are thinking and doing. This survey is one of many tools orderTalk will use to stay ahead of consumer trends.”
The survey found that 94 percent of U.S. adults have ordered takeout and 65 percent order takeout at least once a month. Nearly two thirds of Americans (62 percent) order takeout digitally via an app or website, and of those who have ordered digitally, 67 percent say they prefer to order digitally rather than by phone.
The survey also found significant differences in online ordering habits by sex and lifestyle. For example, males are more likely than females to order takeout at least once a month (69 percent versus 61 percent); Americans with children under the age of 18 in the home are more likely to order takeout at least once a month than those without children under the age of 18 in the home (77 percent versus 59 percent); and renters are more likely than homeowners to order takeout at least once a month (72 percent versus 62 percent).
“The numbers suggest that digital food ordering is extremely popular due to ease and convenience,” said Eldon. “Time-crunched consumers and those who are technologically savvy are leading users of the technology, but this is changing as digital ordering solutions improve and evolve.”
As digitally ordering take out increasingly becomes the “way to go,” orderTalk was interested in gaining insight into why people were ordering online and what, if any, drawbacks existed to online ordering. The survey found that nearly half Americans who have ordered digitally said they do so because it is easier to make sure an order is correct (46 percent). But, 63 percent of those who have ordered digitally have, at some point, abandoned a digital takeout order. The most popular reason cited for abandoning an order, at 28 percent, was because the app or website wasn’t functioning correctly. To support this further, the survey also found that more than half of U.S. adults (55 percent) wish it were easier to order takeout digitally.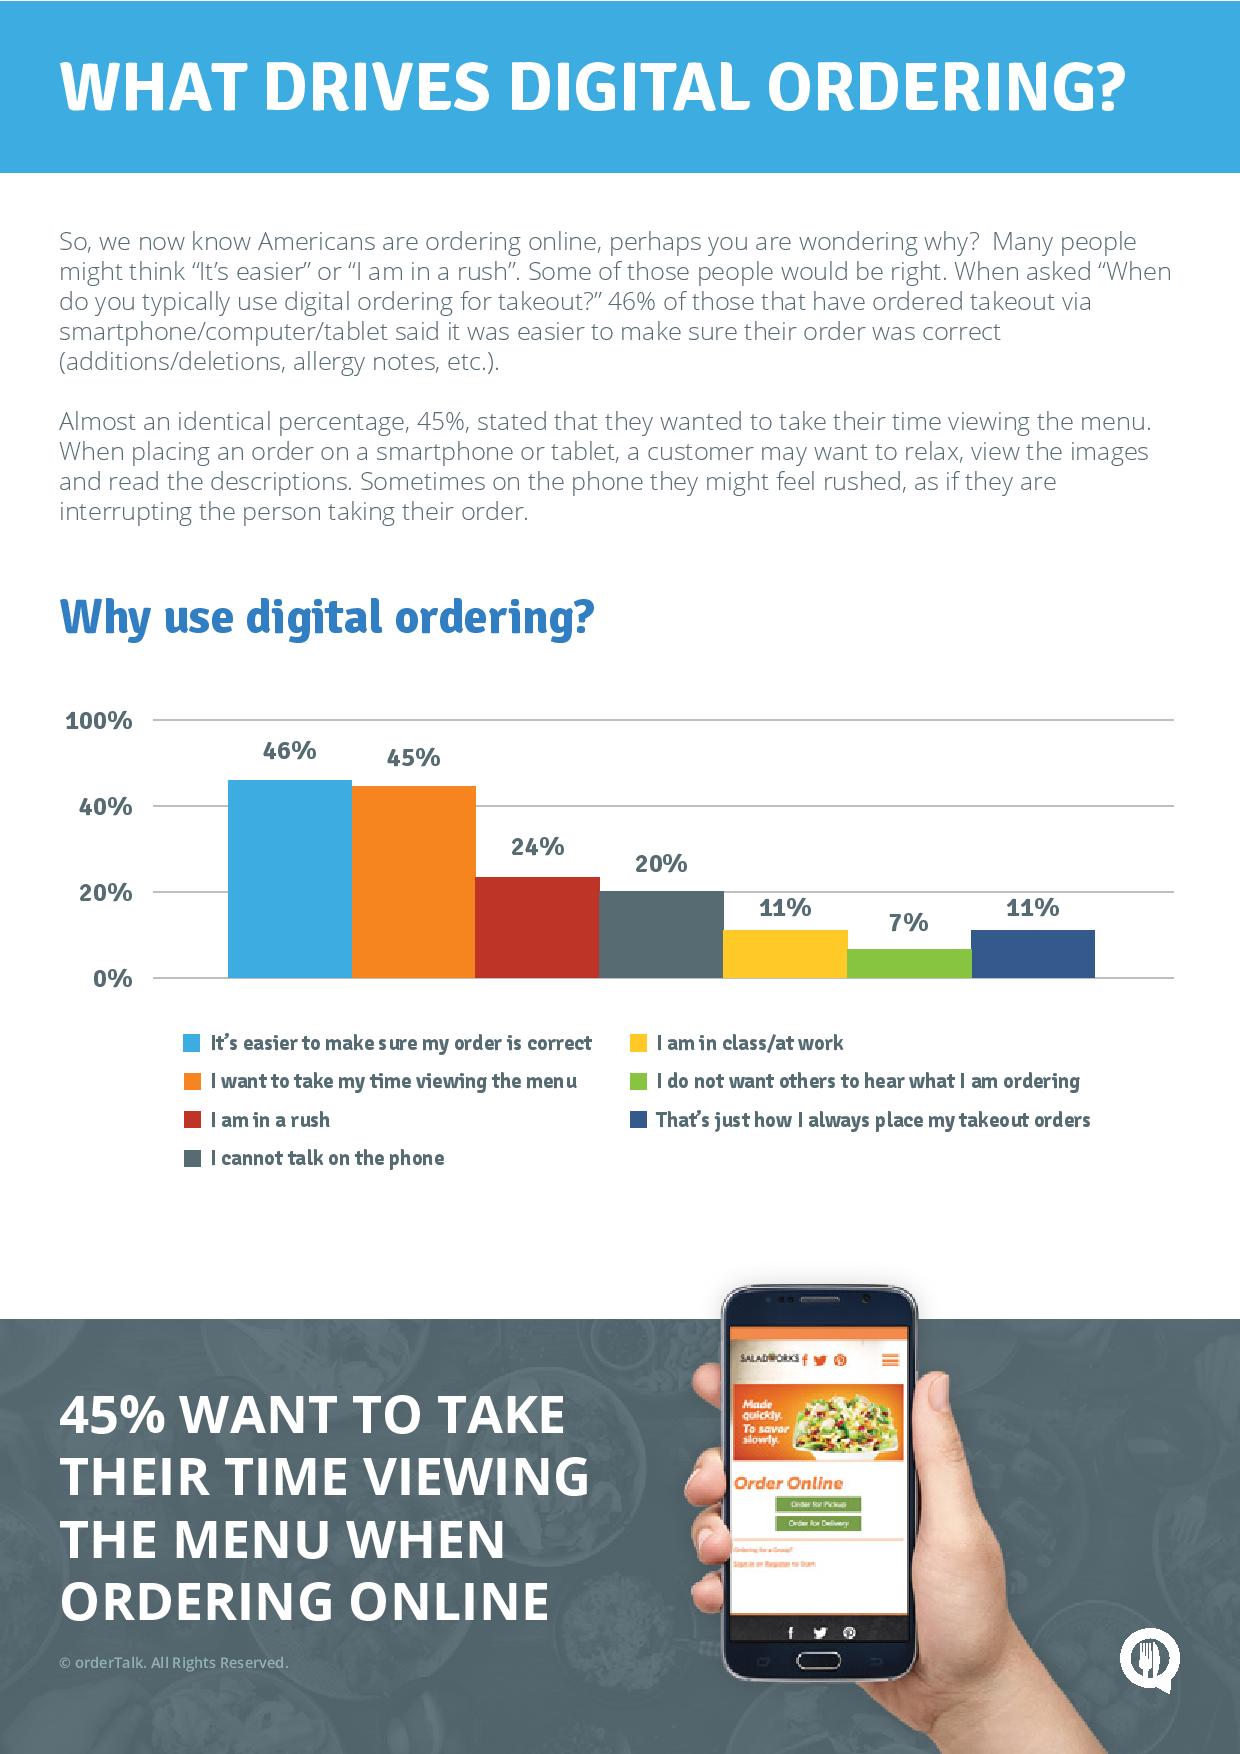
Lastly, 56 percent of U.S. adults said they expect to see discounts when ordering takeout digitally, followed closely by menu item images (52 percent). According to Eldon, “Consumers want a positive digital interaction, just as dine-in customers want to be served by friendly attentive staff.
“Unfortunately for consumers, there are many mediocre digital ordering solutions that restaurants have in place, hoping to increase business and meet the consumer demand,” noted Eldon. “But providing underwhelming technology often achieves the opposite result, turning frustrated customers away and directly into the hands of competing restaurant brands. Now, more than ever, companies must invest in innovative solutions and replace aging technologies.”
If restaurants are going to provide a state-of-the-art ordering platform, that platform should be comprehensive, yet simple to navigate. A digital ordering provider such as orderTalk, which specializes in the complexities of the restaurant industry, is well-equipped to create the digital experience that consumers now require.
To download the comprehensive 2017 Online Ordering Usage Report which includes more survey results, click here.
What a Customer Wants
Customer satisfaction with full-service restaurants is down 3.7 percent to a score of 78 (100-point scale) in a new report from the American Customer Satisfaction Index (ACSI). This is the lowest score in more than 10 years – and the first time that full-service restaurants have been beaten by the fast food category.
“Lower customer satisfaction is a major threat to the restaurant business,” says Claes Fornell, ACSI Chairman and founder. “Full-service restaurants cannot lose to fast food on quality and customer satisfaction because they can’t compete on price. If a lower-price competitor has higher customer satisfaction than a rival that competes on quality, the latter is obviously in serious trouble. Low price alone rarely leads to high levels of satisfaction, but high quality usually does.”
Menu prices are on the rise, but consumers don’t think full-service restaurant quality is currently good enough to justify higher prices. Same-store restaurant sales are down, and foot traffic is shrinking. Independent restaurants and smaller chains, which make up the majority of the industry, are down 4 percent to an aggregate score of 78.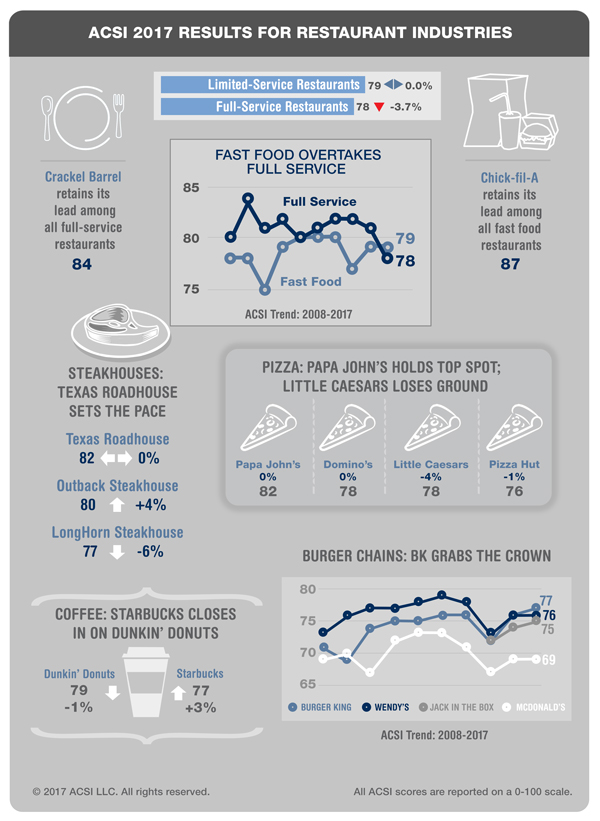
Among the largest chains, restaurant-retail hybrid Cracker Barrel leads for the second year in a row (+1 percent to 84). Texas Roadhouse (unchanged at 82) is the top-scoring steakhouse, and its same-store sales outpaced many of its competitors in the first quarter. Outback Steakhouse comes in at 80 (+4 percent) and LongHorn Steakhouse at 77 (-6 percent).
In third place, Olive Garden is steady at 81 and ties with Red Lobster, which gains 3 percent in a second straight year of improvement. This year marks a four-year high for Red Lobster, which has invested in menu upgrades and higher-quality ingredients. Olive Garden continues to generate sales, benefiting from increases in its to-go business.
Applebee’s (79) and Ruby Tuesday (78) are unmoved, while Chili’s (+3 percent to 77) overtakes TGI Fridays (-3 percent to 76). As sales slump for the category, some chains are looking to redefine themselves, including rethinking locations and off-premise initiatives. Applebee’s introduced wood-fired grills, but this has not yet paid off in higher satisfaction or sales. Ruby Tuesday also stalls for ACSI amid store closings, and the company put itself up for sale in March.
Denny’s improves (+3 percent to 76), but Red Robin sinks to the bottom of the category (-9 percent to 73) as first quarter same-store sales drop 1.2 percent. Like major brick-and-mortar retailers, casual-dining chains like Red Robin have not been immune to an overall trend of declining foot traffic as consumers stay away from malls in greater numbers.
Meanwhile, customer satisfaction with fast food restaurants is stable at an ACSI score of 79. Better quality ingredients, speedy service and low prices are keeping customer satisfaction high. Chick-fil-A remains the leader (87), far ahead of KFC (78). In second place, Panera Bread is up 1 percent, tied with Papa John’s at 82 (unchanged) and the combined score of all other smaller chains and individual fast food restaurants (+1 percent).
Among pizza chains, Papa John’s maintains the lead, followed by Little Caesars (-4 percent to 78), Domino’s (unchanged at 78), and Pizza Hut (-1 percent to 76). Among sandwich makers, Panera Bread (+1 percent to 82) tops Subway (+1 percent to 81) and Arby’s (unchanged at 80).
Chipotle Mexican Grill stabilizes (+1 percent to 79) from a sharp drop a year ago, suggesting that the company is recovering from its 2015 food safety crisis. Same-store sales for Chipotle also rose in the first quarter. Taco Bell (+1 percent) scores 76, and Dunkin’ Donuts (-1 percent to 79) remains ahead of coffee rival Starbucks (+3 percent to 77).
Hamburger chains all fall below the industry average. After lagging Wendy’s for more than two decades, Burger King grabs the crown among burger chains with a 1 percent uptick to 77. Wendy’s (unchanged at 76) and Jack in the Box (+1 percent to 75) follow closely behind. Much lower, McDonald’s continues to occupy last place – flat at an ACSI score of 69.
The ACSI report, which is based on 5,557 customer surveys collected between June 8, 2016, and May 12, 2017, is available for free download.