
MRM Research Roundup: End-of-August 2019 Edition
12 Min Read By MRM Staff
This edition of Modern Restaurant Management (MRM) magazine's Research Roundup features news about the importance of teamwork, kid-friendly restaurants, best beer cities and what cafes have the fastest wifi.
Summer Restaurant Traffic
U.S. consumers visited restaurants this July at the same pace they did last July and consumer spending was up three percent compared to year ago, reports The NPD Group. Total U.S. traffic volume for commercial restaurants in the year ending June was 61 billion visits.
Industry bright spots this summer include quick service restaurant traffic gains and continued visit growth to fast casual restaurants, although increases are not as strong as in previous years, according to NPD’s ongoing foodservice market research. Digital orders, which include internet/mobile app and text message orders for carry out and delivery, are growing rapidly but still represent a small amount of traffic share. On premise dining is also realizing visit gains this summer.
NPD’s SalesTrack® Weekly, which is a national weekly same-store sales pulse of 60 participating brands representing over 113,000 QSR and full service locations, showed healthy dollar growth in July, and the company’s CREST® Performance Alerts, which provides a rapid weekly view of chain-specific transactions and share trends for 73 quick service, fast casual, midscale chains, and casual dining chains, tracked flat to positive gains throughout the month.
Visit declines in the full service restaurant segment continue to prevent the industry from growing. In five years, the midscale/family dining full service category has lost 500 million visits. The casual dining full service category has been holding steady as of late after four years of declines.
“The state of the restaurant industry held steady in July compared to last year, consistent with our long held view on the market outlook,” said David Portalatin, NPD food industry advisor and author of Eating Patterns in America. “The long term fundamentals of the market tell us to expect relatively flat traffic trends in the near term, but there are many pockets of growth, particularly among QSR and fast casual concepts.”
It's All About Teamwork
New research shows that as the service sector continues to struggle with how to manage and minimize low labor productivity that hinders profits, the key may be in one word — “teamwork” — according to a new study in the INFORMS journal Management Science after studying firms in the restaurant industry. Researchers believe, however, that the findings can be generalized among the service sector to include hotel and retail services.
At a high level, the research found that effective teams tend to promote knowledge sharing, repeated collaborations and creativity.
The study, conducted by Fangyun Tan of Southern Methodist University and Serguei Netessine of the University of Pennsylvania, looks at data from three locations of a full-service casual restaurant chain. They observed 226,000 checks between January 2011 and June 2012.
“We found that by pairing strong workers with less strong workers on the same teams, the overall strength of the team improves as those less strong workers are taught, mentored and inspired by their stronger counterparts,” said Tan, a professor in the Cox Business School at SMU. “This implies that to maximize sales, managers should create teams that combine staff members of different ability levels for the same shift. Our research tells us that doing this may increase total sales by nearly 2.5 percent at no extra cost.”
Tan and Netessine find this improvement is due to peer effects and the spillovers between coworkers’ abilities and the performance of others.
The study suggests not only should managers mix workers with varying ability levels during the same shift, but also place high-ability workers at a more visible position to maximize positive spillovers on their colleagues and reconsider their compensation to reward their positive spillovers. For the full study, click here.
Top Kid-Friendly Restaurants
To help families find the perfect restaurant, OpenTable, treleased its list of the 50 Most Kid-Friendly Restaurants in America for 2019.
Featuring restaurants coast-to-coast across 16 states and Washington, D.C., the list is culled from more than 12 million verified diner reviews of over 30,000 U.S. restaurants. From NINJA in New York to Aquarium in Denver, the Most Kid-Friendly list has plenty of establishments that will be sure to please diners of any age. Florida and New York tie in first for the most honorees (seven), followed by Hawaii with six and California and South Carolina both with four each. Georgia, Illinois and Washington, D.C. follow, all boasting three honorees. Colorado, Maryland, Massachusetts, Michigan, New Jersey, Ohio, Pennsylvania, Tennessee and Texas are also featured.
“When you’re dining out with kids, you want to find a restaurant that has something for everyone – a menu that appeals to younger diners, great cocktail options for the adults and, of course, the ambiance to match,” said Caroline Potter, Chief Dining Officer at OpenTable. “Whether you’re a family of foodies celebrating something special or you’re avoiding doing dishes on a weeknight, these restaurants have a fun family-friendly vibe and fare that’ll hit the spot.”
OpenTable’s list of the 50 Most Kid-Friendly Restaurants in America for 2019 is generated solely from diner reviews collected between July 1, 2018 and June 30, 2019. All restaurants with a minimum “overall” rating and number of qualifying reviews were included for consideration. Qualifying restaurants were then scored and sorted according to the sum of tags for which “kid-friendly” or “child-friendly” was selected as a special feature.
Based on this methodology, the 50 Most Kid-Friendly Restaurants in America for 2019 according to OpenTable diners, are in alphabetical order as follows:
50 Most Kid-Friendly Restaurants in America for 2019
Aquarium Restaurant – Multiple Locations
Becco – New York, New York
Benihana – Multiple Locations
Bill’s Bar and Burger – New York, New York
The Boathouse – Lake Buena Vista, Florida
Buddy V’s at The Venetian – Las Vegas, Nevada
Cap City Fine Diner & Bar – Grandview – Columbus, Ohio
Carmine’s – Multiple Locations
Cattle Company Steakhouse – Pearl City – Pearl City, Hawaii
Columbia Restaurant – Multiple Locations
The Dead Fish – Crockett, California
Farmers & Distillers, Washington, D.C.
Farmers Fishers Bakers, Washington, D.C.
Fire + Ice Boston – Boston, Massachusetts
Fleet Landing Restaurant & Bar – Charleston, South Carolina
Founding Farmers – Multiple Locations
Frankenmuth Bavarian Inn Restaurant – Frankenmuth, Michigan
Hard Rock Cafe – Multiple Locations
Hell’s Kitchen – Caesars Palace Las Vegas – Las Vegas, Nevada
Henry’s Louisiana Grill – Acworth, Georgia
House of Blues Restaurant & Bar – Orlando – Lake Buena Vista, Florida
Keoki’s Paradise – Koloa, Hawaii
Kobe Japanese Steakhouse – Multiple Locations
L. Woods Tap and Pine Lodge – Lincolnwood, Illinois
Little Goat – Chicago, Illinois
Loveless Cafe – Nashville, Tennessee
Maggiano’s – Multiple Locations
Mama’s Fish House – Paia, Hawaii
Max Brenner – Multiple Locations
The Mill House – Waikapu, Hawaii
Monkeypod Kitchen – Multiple Locations
Mrs. Knott’s Chicken Dinner – Buena Park, California
NINJA NEW YORK – New York, New York
Old Lady Gang – Atlanta, Georgia
Old Oyster Factory – Hilton Head Island, South Carolina
The Pirates’ House – Savannah, Georgia
Raglan Road Irish Pub – Lake Buena Vista, Florida
Rainforest Cafe – Multiple Locations
Sea Captain’s House – Myrtle Beach, South Carolina
Skull Creek Dockside Restaurant – Hilton Head, South Carolina
The Smith- Lincoln Square – New York, New York
Sugar Factory – Multiple Locations
Tavern on the Green – New York, New York
Tony’s Di Napoli – Midtown – New York, New York
True Food Kitchen – Palo Alto – Palo Alto, California
Ulele – Tampa, Florida
Uncle Julio’s – Multiple Locations
Virgil’s Real BBQ – New York City – New York, New York
Wolfgang’s Steak House – Waikiki Beach – Honolulu, Hawaii
Zehnder’s of Frankenmuth – Frankenmuth, Michigan
The complete list may also be viewed here.
Flexiblity in the Workplace
According to a July 2019 FlexJobs survey of more than 2,000 women with children 18 and younger living at home, 31 percent of women who took a break in their career after having kids wanted to keep working, but reported that their jobs were too inflexible to remain in the workforce. Forty-two percent said it was either extremely difficult or difficult to restart their career after taking a break. The labor force participation rate for all women with children under age 18 was 71.5 percent in 2018, up slightly from the prior year.
“According to BLS data, mothers with young children are less likely to be in the labor force than those with older children, and, as our findings support, part of this is due to lack of flexible work options,” said Sara Sutton, founder, and CEO of FlexJobs. “Flexible work arrangements, like working from home or with a flexible schedule, can help not only working moms remain in the workforce, but also other groups that are balancing many personal and professional responsibilities as well, such as military spouses, caregivers, people with health issues, working dads, semi-retirees, and more,” Sutton concluded.
Additional survey findings include:
Career paths and challenges
- 31 percent of women with children 18 and under who took a break in their career after having kids wanted to keep working, but their jobs were too inflexible to stay in the workforce
- 70 percent who off-ramped their career after having kids said it was difficult to re-enter the workforce
- 71 percent have left or considered leaving a job because it lacked flexibility
- 40 percent are concerned that having flexible work arrangements will hurt their career progression
The importance of work flexibility
- Work-life balance (82 percent), flexible work options (78 percent) and work schedule (77 percent) were ranked ahead of salary (76 percent) as the top factors they use to evaluate potential job prospects
- Over half (56 percent) have tried to negotiate flexible work arrangements with their employers but only 32 percent have been successful
- Just 13 percent are extremely confident in their ability to negotiate a flexible work arrangement
- 86 percent said having kids living at home has affected their interest in a flexible job
Employer relationships
- 31 percent would consider taking a pay cut in exchange for the option to telecommute as much as they wanted
- 85 percent would be more loyal to their employers if they had a flexible work arrangement, compared to 80 percent of general workers who say the same thing
- 64 percent think they are more productive working from home than in a traditional workplace.
- Nearly half (48 percent) have felt discriminated against in the workplace because of their gender
Mothers are confident in their dual parent/employee roles
- The majority report “needing” to work, but 73 percent—more than two out of three parents—also report “wanting” to work
- 84 percent are entirely sure that they can simultaneously be both great employees and great mothers
- 91 percent also indicated that flexible work arrangements would increase their volunteerism at their children’s schools or organized activities
The mothers who responded to FlexJobs’ survey were highly educated, with 70 percent having at least a bachelor’s degree and 28 percent having a graduate degree.
Gen X Wine Lovers
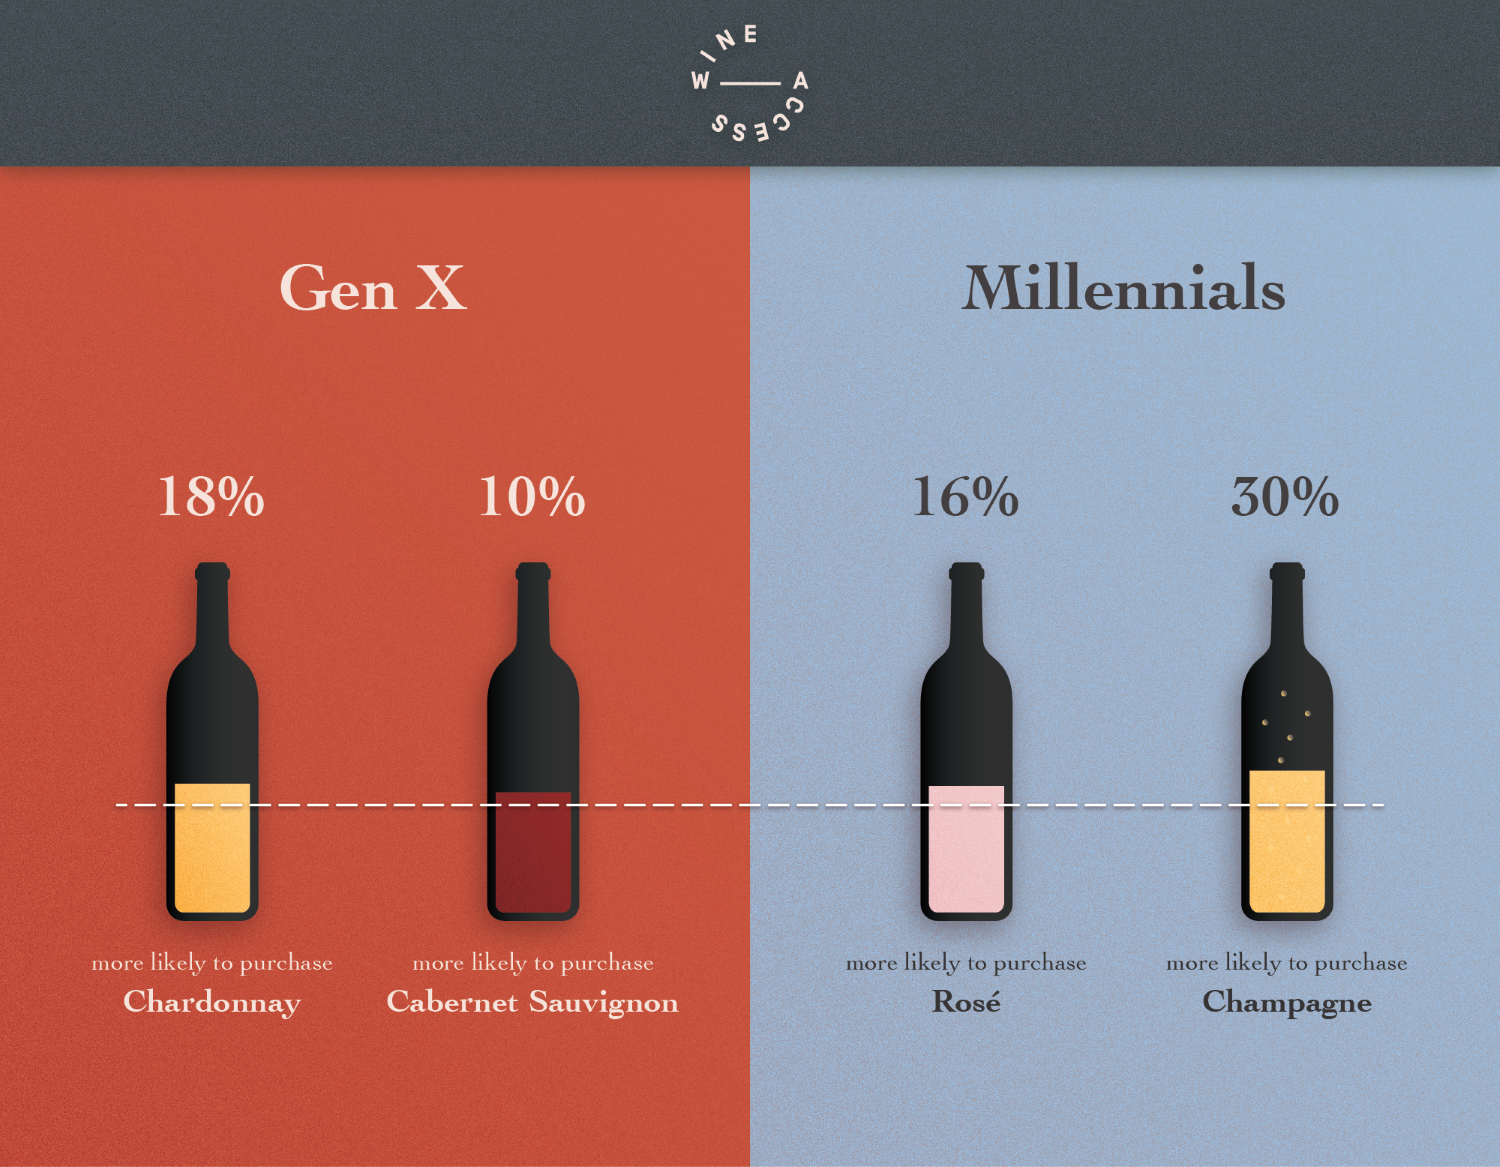
A recent Wine Access internal study of sales data that shows Generation X holds greater immediate purchasing potential than Millennials, despite greater industry focus on wooing the younger generation. The data, which spans 2017 to 2019, supports recent media reports that suggest Gen X (currently ages 37-52) is a key demographic that should not continue to be overlooked when it comes to wine marketing.
According to Wine Access, the average Gen X customer order, in dollars, was 13 percent greater than all other demographics between 2017 and 2019, beating out both Boomers (currently ages 53-71) and Millennials (currently ages 21-36). While Wine Access has seen major growth in Millennial sales over the last three years, Gen Xers spent nearly 6 percent more per order than their younger peers in 2019. Boomers continue to outperform Gen X in average number of bottles per order, but spend less on average.
“Boomers have historically driven our business, but Gen Xers are becoming the big buyers,” notes Joe Fisch, CEO of Wine Access. “While we have seen significant growth among our Millennial buyers in recent years, our sales show that Gen X holds the most immediate potential. Like Millennials, Gen Xers seek authenticity and intimate experiences when purchasing wine, but Gen Xers have greater financial resources at their disposal to pursue them. That’s why we invest in telling the story of every bottle of wine we sell through text, infographics, and video, developed by our team of wine experts.”
Wine Access has over half a million members, secured primarily without paid advertising. Approximately 25 percent of all new buyers are referred through forwarded email offers, which are loaded with content, sharing the wine’s story in 500 to 1,000 words written by an expert. “It’s our dynamic content and close relationships with the world’s best producers that attract our buyers, plus our ability to offer wines that aren’t available elsewhere,” commented Vanessa Conlin, Head of Wine. “By examining purchasing patterns of each demographic, we can understand reactions to our content and see valuable consumer trends. For instance, Gen Xers are more likely to make purchases based on their established tastes, while Millennials tend to buy in correlation with industry trends.”
Following the data, compared to all other demographics, Gen X is 13 percent more likely to purchase Cabernet Sauvignon, 13 percent more likely to purchase Left Bank Bordeaux, and 12 percent more likely to purchase Right Bank Bordeaux. Meanwhile, Millennials are 46 percent more likely to purchase Champagne, 29 percent more likely to purchase Tempranillo, and 24 percent more likely to purchase Rosé than other demographics.
These patterns in Millennial purchases are aligned with domestic consumption trends: the sparkling wine segment (domestic and international) grew almost 6 percent in 2018 and consumption grew by 56 percent in the last decade (Beverage Wholesaler, 2019). The Rosé category grew by 48 percent in 2018 alone to $4.6 million in sales (Beverage Industry Enthusiast, 2019).
Although Millennials are buying based on trends more than other demographics, they do continue to purchase more traditionally sought-after varietals from Wine Access. For instance, Cabernet Sauvignon accounted for nearly 27 percent of all Millennial purchases, trailing Gen X by only 3 percent. Millennials also buy historically popular categories such as Sauvignon Blanc, Sangiovese, and Bordeaux at a similar rate to Gen X, and even out-buy Gen X in some esoteric categories, such as Brunello di Montalcino and Châteauneuf-du-Pape. That being said, both generations also explore beyond these categories, as Wine Access offers a wide selection that includes lesser-known varieties and regions.
Beer Loving Cities
What cities have the most breweries? Apartment Guide is out with the top 10 cities for beer lovers. The list was calculated by taking every city in the U.S. with a population of more than 50,000, and which contains at least five breweries according to the Brewers Association and ranking the number of breweries per 100,000 residents. For more information, click here.
Fastest Wifi
PCMag published a report revealing which coffee shops have the fastest Wifi in the nation — the result of having analyzed nearly 100,000 tests via Ookla Speedtest. With more people working remotely than ever before, we wanted to discover which coffee shops offer the greatest reliability for the modern workforce.
Here’s what the data revealed:
- Joe & the Juice takes the crown for the fastest coffee chain Wi-Fi, while Dunkin' Donuts beats Starbucks in terms of speed among big national chains.
- Joe & the Juice locations beat out Dunkin' Donuts this year with average download speeds of 42.4Mbps compared with 40.4Mbps. The fastest Joe & the Juice shops are all in New York City; every test we saw with speeds over 100Mbps is in Manhattan.
- One thing we noticed: Coffee shop chains, these days, are highly regional. With Dunkin' and Starbucks removed from the map, different chains are clustered in different locations. We found that Peet's is California-centric, while Caribou is focused in the upper Midwest, Krispy Kreme is primarily in the South, Tim Horton's has a lot of locations in Ohio and Michigan, and Caffe Nero is primarily around Boston.
- So for a quick, highly caffeinated upload, Dunkin' Donuts is your best bet. Joe & the Juice is a place to sit around for a while and work. Starbucks comes in second among coffee shops that encourage you to hang around and work.
- As with last year, the different ways people use Dunkin' and Starbucks Wi-Fi may also play a role in Dunkin's win over Starbucks. Starbucks encourages people to sit around for hours with laptops; Dunkin's are built to cater to a faster pace, on-the-go consumer.
For the full results, click here.
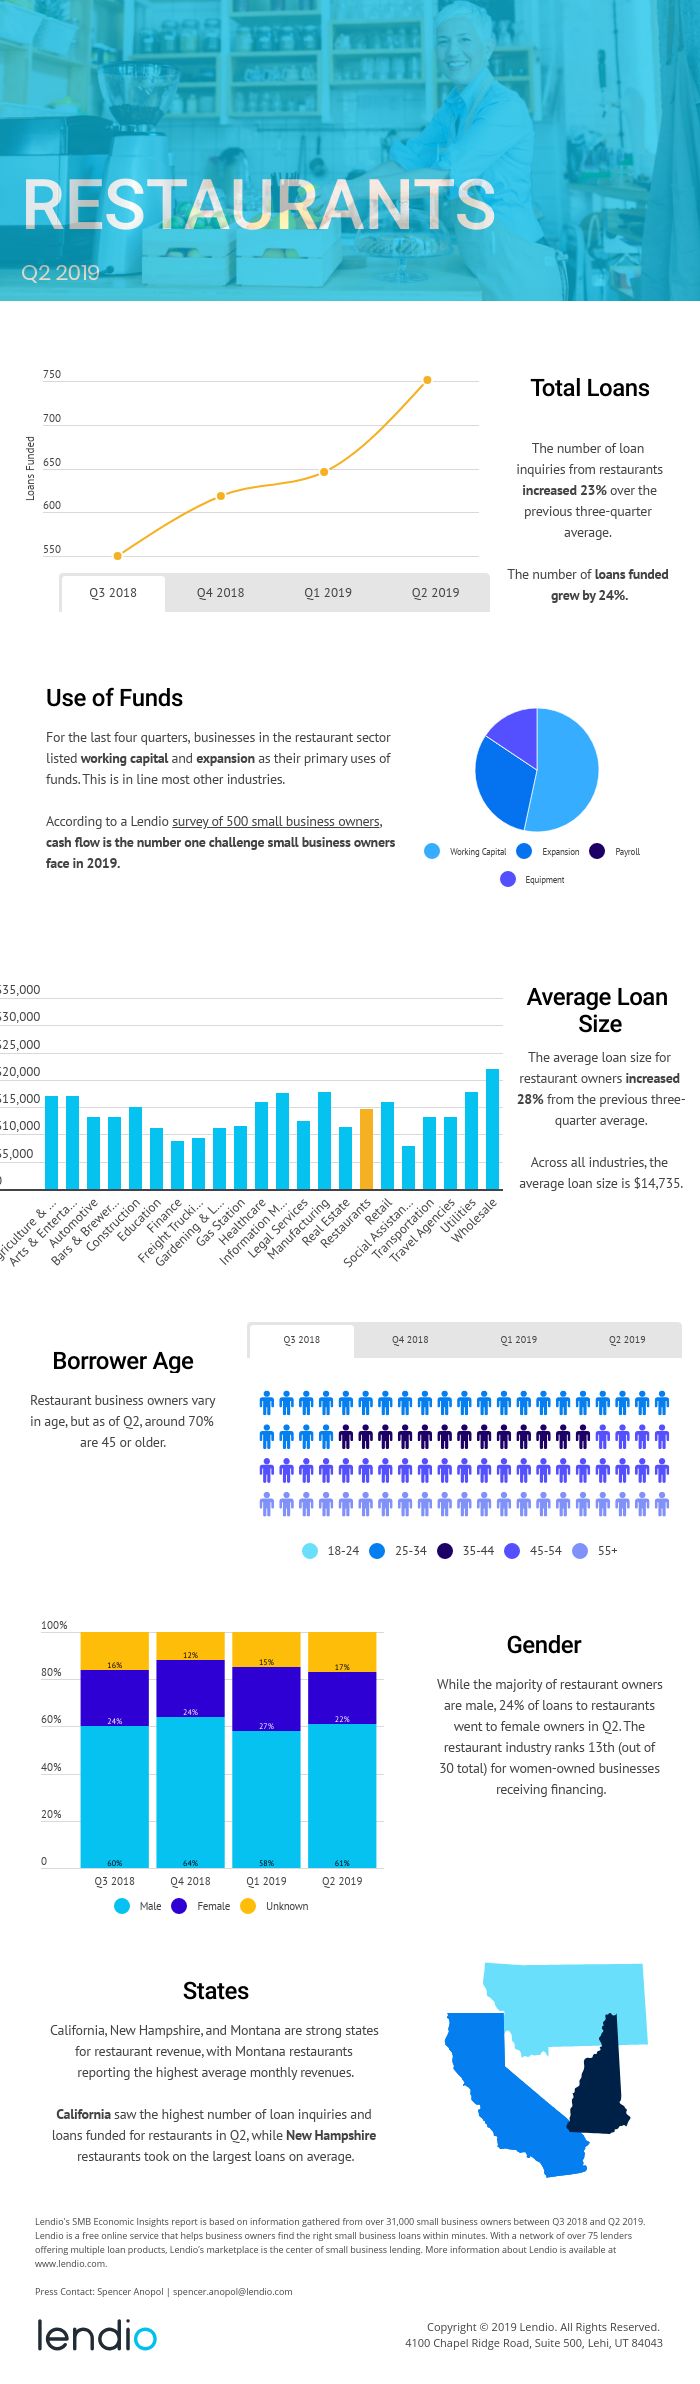
Business Lending for Restaurants
According to a study from Lendio, small restaurants have seen a 23 percent growth in small business loan inquiries over the previous three-quarters. Additionally, the industry's funded loans have grown by 24 percent in the same period.
Other highlights include:
- Restaurant borrowers skew older. The industry ranks 17th out of 30 studied for borrowers under the age of 44. This last quarter, 70 percent of borrowers were over 45.
- Over the last year, restaurant owners take on some of the largest loans, ranking 5th in average loan size ($19,806).
- The restaurant ranks 14th in terms of the percentage of female borrowers (24 percent).
- Small business loans seem daunting to some small business owners, but it doesn't have to be complicated.
Market Getting Saucy
The U.S. sauces market is predicted to attain a size of $22.4 billion by 2024, progressing at a 3.3 percent CAGR during the forecast period.
The growing popularity of ethnic cuisines, busy lifestyle, changing consumer preferences to healthier products with a unique flavor, and increasing disposable income are some of the factors contributing to the growth of the market. On the basis of table sauces, the market is classified into tomato, mayonnaise, soya, barbecue, chili, Schezwan, horseradish, oyster, mustard, and other sauces.
Out of these, the mayonnaise classification held the largest share in the U.S. sauces market. The surging popularity of salads and fast food as well as the rising consumption of snacks by the young population are resulting in the increasing use of mayonnaise across the nation. However, the chili and soy sauce classifications are expected to witness the fastest growth in the market during the forecast period. When segmented by distribution channel, the market is categorized into convenience stores, supermarkets/hypermarkets, online, specialist stores, and others.
Among these, in 2018, the supermarkets/hypermarkets category held the dominating share of more than 70.0 percent in the U.S. sauces market. Due to the changing preferences and surging number of supermarkets/hypermarkets, consumers, nowadays, are heavily buying sauces via such stores. However, during the forecast period, the online channel classification is predicted to exhibit the fastest growth in the market, which can be ascribed to the rising retail e-commerce sales in the nation.
In 2018, e-commerce platforms held a 14.3 percent share of the overall retail sales, a surge from 12.9 percent in 2017. Thus, the expanding e-commerce industry is projected to help the U.S. sauces market advance during the forecast period. This market is highly competitive for existing and potential players, and it is projected to create huge opportunities for them during the forecast period. Companies such as The Kraft Heinz Company, C.H. Guenther & Son Inc., and Conagra Brands Inc. are actively participating in the mergers and acquisitions to increase their market share across the globe.
Further, The Kraft Heinz Company and McCormick & Company Incorporated are continuously aiming on partnerships to serve consumers better with advanced technologies and new products. The growing popularity of ethnic cuisines is one of the major factors contributing to the growth of the sauces market in the U.S. Due to the rapid globalization and culinary culture exchange, the consumption of ethnic cuisines is increasing. The younger population in the nation is now becoming experimental; they like to explore new flavors and different cuisines. The surging popularity of ethnic cuisines, such as Mexican, Chinese, Italian, Greek, Japanese, and Indian, is generating good revenue in the sauces market.
The "U.S. Sauces Market Research Report: By Type, Distribution Channel, Regional Insight – Industry Size, Share Analysis and Forecast to 2024" report has been added to ResearchAndMarkets.com's offering.