
MRM Research Roundup: End-of-October Edition
39 Min Read By MRM Staff
Modern Restaurant Management (MRM) magazine's "According to a recent study/survey …" column has been rebranded as MRM Research Roundup.
This time, we feature why "Blackout Wednesday" is a time bars and restaurants need to stock up and be well-staffed, emerging dining trends, the best cities for restaurants to be located, best vegetarian restaurants, the importance of responding to reviews, driverless cars and delivery and food trend predictions.
Stock up for Blackout Wednesday
While Black Friday is considered the biggest sales day of the year for big box retailers, the Wednesday night before Thanksgiving — deemed “Blackout Wednesday” in recent years — has become the same for local restaurant and bar owners. With practically everyone having Thanksgiving Day off of work and no reason to wake up before football games begin, it’s clear why this night has become a cultural phenomenon.
To get an idea of just how much restaurants and bars throughout the country can expect to see their sales rise the night before Thanksgiving, restaurant management platform Upserve tapped into data from over 10,000 bars and restaurants to see just how much these customers are drinking—and what they’re ordering—on Blackout Wednesday to help restaurants prepare ahead of time.
- Beer and Booze‒it’s what their drinking: Data from 2015 to 2017 revealed that from the Tuesday to the Wednesday before Thanksgiving, there was a 63 percent increase in average liquor sales, a 68 percent increase in average beer sales and 62 percent in cocktail sales.
- But guests aren’t coming with big appetites for food: Despite the rise in drinking, food orders only increased by 27 percent, and comparing Blackout Wednesday to the Wednesday prior from 2015 to 2017, food units per check have historically decreased the night before Thanksgiving, from 1.25 units per check to 1.22 but booze increased.
- There’s a new found love for wine: While beer and booze are the most popular drinks of choice, wine sales have increased year over year. From 2015 to 2017, wine sales increase 20 percent on Blackout Wednesday
Bottom line for restaurateurs: Stock up on beer + liquor and make sure your bar is well-staffed on November 21.
To learn more, click here.
Four Emerging DiningTrends
Euromonitor International published a new white paper, “New concepts in Foodservice: Best of 2018” highlighting emerging restaurant concepts around the world that explores four foodservice industry trends in the impacting consumers’ expectations regarding the dining experience.
Clean and Green Living
As health and ethical trends become increasingly important for consumers, foodservice players are embracing localisation, the shortening of distances between the source of an ingredient and the restaurant. Some restaurants take this even further by “hyper-localising” the supply chain with urban farming because of environmental benefits and the perception of fresher food.
Individualised Eating Experiences
Restaurants are offering more tailored dining experiences to a variety of consumer types such as solo diners with the increasing popularity of single-portion meals in metropolitan cities where consumers cook less and eat out more. Meals designed specifically for individual portions also help reduce food waste and are particularly attractive to consumers with dietary control and calorie counting concerns.
Increasing Engagement Through Gamification
Gamification is an emerging digital strategy for restaurants looking to engage with consumers in and out of the restaurant by integrating games or challenges into the dining experience, creating a deeper connection between the consumer and brand. This level of engagement can push a brand to the forefront of the consumer’s mind and can incentivise them to return for future visits.
Connecting with the Busy Consumer
Time-crunched consumers need more convenient dining options and new innovative technologies are allowing restaurants to meet this growing demand for convenience. Consumers want frictionless meal options and higher quality meals delivered to their homes or on-the-go. Third-party players and digital-friendly formats are catering to the busy consumer, but expectations are higher than ever.
Stephen Dutton, senior foodservice analyst at Euromonitor International explained, “Global foodservice is expected to increase by an additional USD 359 billion over the next five years. The battle to earn part of this additional revenue is more difficult than ever as consumer expectations are higher, placing more pressure on foodservice operators to incorporate quality into every inch of the experience or risk losing out to more daring concepts.”
F&B Consumables
Food and beverage categories have seen a meaningful increase over the last two years, as many major retailers saw same store sales rise thanks to an increase in median income and a low unemployment rate, according to the TABS Analytics 6th Annual Food and Beverage Consumables Study. The study identified solid share gains for online grocery but found that the format is still a small player in the $800 billion industry, accounting for less than five percent of sales.
“Growth in virtually every category of food and beverages examined in this year’s study can be attributed to two underlying trends: more buyers purchasing those products and heavy buyers increasing the amount of those products that they purchase,” said Dr. Kurt Jetta, president and founder of TABS Analytics. “Online retailers still have a lot of ground to make up to see the same kind of penetration we’ve seen in other markets, such as vitamins and products for children.”
TABS’ Sixth Annual Food and Beverage Study was conducted in August 2018 by TNS and was designed to uncover how consumer buying patterns within these categories are shaped by the promotions offered. There were 15 consumables categories analyzed: candy, carbonated beverages, cereal, cookies, crackers, frozen pizza, ice cream, juice (refrigerated), juice (shelf), frozen novelties, popcorn, salty snacks, sports drinks, water and yogurt.
Other key findings from the study include:
More Buyers, More Frequent Purchases Drive Category Gains – The study examines a two-year compound annual growth rate (CAGR), which saw salty snacks overtake the No. 1 position, followed by frozen pizza, novelties and popcorn, which all showed strong gains. The only category that declined in the past two years is carbonated beverages, which still has a purchase frequency that outpaces water.
Top Demographics: Millennials, Households with Kids Above Average Buyers – When looking at the heaviest buyers, both millennials (ages 18-34) and households (HH) with kids exceed the average by 2 to 3 percentage points. With median income rising, gains were seen in the middle-income levels, not just the highest income bracket.
Top Deal Tactics: Low Prices and Circulars – Everyday low price (EDLP) remains the favored deal tactic, growing in popularity among those ages 18-34, while circulars rose to No. 2. Deal search declined significantly year over year, as households with kids seemed to prefer convenience to bouncing from store to store to get the best prices.
Traditional Grocery and Walmart Still Most Favored Outlets – That quest for convenience seems to have led consumers to traditional grocery stores and Walmart. Despite their commanding lead, traditional grocery and Walmart saw a 2-percentage point year-over-year decline each, as small format stores – such as dollar stores, drug outlets and value food banners, like Aldi – experienced gains of 2 to 4 percentage points at their expense.
Online Grocery Growing, But Nowhere Close to Success Threshold – Despite a 4-point year-over-year increase, the number of regular online food and beverage purchasers (defined in the study as six or more purchases per year) is still only 17 percent. Only 38 percent of consumers shop in the format even once, and well under half of the shoppers (44 percent) are loyal to the format.
”The stated loyalty rates (the percentage of online grocery shoppers that purchase there regularly) of online grocery shopping are well below the 75 percent level needed to ensure a viable, successful business model,” stated Dr. Jetta. “This format has a long way to go to achieve a stable demand; until then eComm grocery will be relying on having to invest in expensive trial-generating activities.”
Demand for Trendy Organic and Diet Items Wane – While there may be much hype about the importance of having organic and diet products in the mix, consumer preferences indicate that these are not likely to become anything greater than niche markets. Only 13 percent of consumers said they try to purchase organic (-1 point compared to 2017), while low-cal/no-cal products showed a significant 4 percentage point year-over-year decline, indicating that it's not as big a priority for consumers as in the past.
Top Four Brick and Mortar Outlets Dominate Candy Sales – In this year’s study, TABS Analytics did a deeper dive into the candy market. While chocolate was more popular for holiday-related candy purchases, it was almost a tie between chocolate and non-chocolate in everyday purchasing. Walmart, Target, dollar stores and traditional grocery accounted for two-thirds of all candy purchases.
Top Cities for Successful Restaurants
There’s no shortage of movies and TV shows about the plight of restaurant owners — their initial struggle and ultimate rise to success. But the restaurant industry can be punishing, leaving many entrepreneurs with only the effort and dashed dreams. LendingTree analyzed the 50 largest U.S. cities to see which offers prospective restaurateurs the best shot at success. Many top spots are in once-overlooked Midwestern cities now experiencing urban renewal. The least promising cities have historically been the restaurant industry’s most competitive.
Eating out has long been an American pastime — and growing. More than one million restaurants operate in the U.S., generating $799 billion in sales. Restaurants are expected to create 1.6 million new jobs by 2027. But despite the size and scope of the industry, it remains a challenging landscape for business owners. Changing consumer tastes and purchase behavior, as well as rising labor costs, continue to put pressure on restaurant owners, who must evolve their business models, menus and technology to keep their doors open.
However, it’s not all bad news for the industry. Restaurant sales have seen an uptick in recent years though it’s unclear if that’s due to an increased number of diners or Americans simply spending more. But a national rise in wages could motivate people to eat out more often. Either way, it creates a growing opportunity for restaurateurs. And despite commonly held beliefs that nearly all restaurants fail right away, their median life span is about 4 1/2 years.
To find out where prospective restaurant owners may have a better chance at succeeding, LendingTree looked at four factors within the 50 largest metros in America:
Average estimated annual revenue: Using the reported monthly deposits of more than 5,400 restaurant owners who sought small business loans on the SnapCap by LendingTree business loan platform, we estimated their annual revenues and adjusted them based on prices in their particular city. For example, rent and labor in San Francisco are significantly higher than the same costs in Cincinnati, so raw revenues only tell part of the story. They normalized the revenues using the regional price parity index from the Bureau of Economic Analysis so that $10 in Cincinnati revenue represents the same buying power as $10 in San Francisco.
Estimated payroll costs per employee: To get a sense of where labor costs may have a smaller impact on restaurants, we used the total annual payroll and employees for restaurants in each metro, as reported in the County Business Patterns survey from the U.S. Census Bureau to calculate the average annual cost per employed person.
Number of restaurants per 100,000 households with incomes of $50,000 or more. These households spend the most on eating out, according to the Bureau of Labor Statistics, but some metros may be underserving these households eager for new restaurant choices.
Number of restaurants per 100,000 residents aged 35-54. Gen Xers have a greater appetite for restaurant spending than millennials or baby boomers, according to the same BLS survey. This may present an opportunity for cities dominated by this generation with relatively few restaurants.
Opportunity is ripe in ‘flyover country’
While traditional foodie destinations like New York and San Francisco are saturated with restaurants, up-and-comers have room to grow. You may not immediately think of Milwaukee and Cincinnati as foodie destinations, but they represent opportunities for new restaurant owners to find their footing. The restaurant population in these cities is less dense than in other areas while labor costs are lower, leaving room for newcomers to make a name for themselves.
1. Milwaukee
Final score: 82.5
Hello Milwaukee. Milwaukee ranked highest in our study, earning a score of 82.5. There are 709 restaurants per 100,000 households with an income of $50,000 or more. Among residents between the ages of 35 and 54 – the age group that spends the most on dining out – there are 591 restaurants per 100,000 people. Milwaukee diners may be hungry for a wider array of options.
About 1,576,236 people live in the area where the median age is about 38 years old, within the threshold of the group that spends the most at restaurants.
New eateries are popping up in the area, but businesses face the same problems that are plaguing the industry at the national level. Restaurateurs in Milwaukee have a limited selection of culinary professionals, creating competition among business owners trying to fill cooking positions.
However, the market is holding up despite multiple recently reported restaurant closings. The estimated normalized median revenues of restaurants in the Milwaukee area is $350,784 and the average annual payroll per employee is $14,510. Payroll costs are a bit lower in Milwaukee, edging it above No. 2 Cincinnati, where the normalized median revenue is $370,944 and the average annual payroll is $14,813.
2. Cincinnati
Final score: 78.4
Second-place Cincinnati. While Cincinnati’s restaurant scene is prosperous, the majority of eateries in the city are chain establishments. But residents tend to prefer independent restaurants, creating a prime opening for prospective local restaurateurs.
There are about 2,180,746 people living in the area where the median age is about 38 years old, about the same as Milwaukee.
3. Minneapolis
Final score: 77.4
Ranking No. 3 in our study, Minneapolis has even fewer restaurants among the designated demographics. There are 629 establishments per 100,000 households with $50,000 or more in income, and 574 restaurants per 100,000 residents between the ages of 35 and 54 years old.
Minneapolis has seen a number of restaurant closings in the past year, many opening and shuttering their doors within 12 months. Rather than one unifying reason, restaurant owners say they have closed down because of varying circumstances, from rising costs and local competition to poor locations and restaurant concepts.
But some Minneapolis restaurants and chefs have gained national attention and the city’s wine scene is becoming one of America’s best. As Minneapolis’ culinary profile rises, new restaurant owners could benefit from diners who are eager to try the next big thing.
Entrepreneurs face challenges in culinary capitals
The lowest-ranking metros in the study are cities with world-renowned restaurant scenes. The local restaurant industry is overcrowded in these places, making it difficult for new restaurant owners to be successful.
50. New York
Final score: 17.3
Big Apple. New York ranked last at No. 50, earning a score of 17.3. The adjusted median revenue is relatively low, $224,640, and payroll costs are high at an average annual payroll per employee of $22,581. There are 993 restaurants per 100,000 households with incomes of $50,000 and 791 establishments per 100,000 residents between the ages of 35 and 54.
49. San Francisco
Final score: 24.8
San Francisco, in the No. 49 spot, is about as equally dense but restaurants in the area rake in more money. The normalized median revenue for restaurants in the city is $361,440, but the average annual employee payroll is $23,325, which means even higher labor expenses than New York. San Francisco restaurant owners also have high food expenses as well, especially when restaurateurs increasingly have to cater to diners expecting quality, ethically sourced selections.
48. New Orleans
Final score: 32.3
Big Easy. Our third least promising place to open a restaurant is New Orleans. Though far smaller by population compared with New York and San Francisco, the Southern city has more a competitive restaurant scene. There are 1,069 eateries per 100,000 households with $50,000 in income, and 759 restaurants per 100,000 residents between the ages of 35 and 54.
Though the cities at the bottom of our list have flourishing food cultures, their high costs and fierce competition do not make them ideal for new restaurant owners.
In addition to the challenges brought on by location, new restaurant owners may have difficulty funding the operation as well. Obtaining financing can be challenging, especially if the owner has no previous experience owning or managing a restaurant, said Hunter Stunzi, senior vice president of small business at LendingTree.
Lenders often view restaurants as higher-risk businesses because of high turnover and failure rates, he said. Most new restaurants will have significant upfront costs, and owners usually need outside financing. Start-up costs could include:
- Leasing or purchasing a location
- Permits
- Outfitting the building for the restaurant
- Leasing or purchasing equipment
- Hiring staff
- Purchasing perishable inventory
- Marketing
All of these expenses can add up quickly. Long before buying their first commercial stove, business owners should first visit a bank to seek financing from the Small Business Administration, Stunzi said. An SBA loan could cover fixed expenses such as the location purchase and buildout. Online alternative lenders could be a good option for leasing equipment or obtaining working capital to cover inventory, marketing and payroll, he said.
Whether submitting an application to a bank or an online lender, new restaurant owners should be prepared to submit a clear business plan and a detailed description of their past experience, as well as the current management team at the restaurant. New owners would also have a better chance of approval if they have a strong personal credit profile and assets to offer as collateral on a loan.
“Any lender to a new restaurant will be very focused on the business plan and the owner’s experience,” Stunzi said.
Prospective restaurateurs can learn more about the steps to starting a restaurant here.
Top Vegetarian Restaurants
With interest in vegetarian and plant-based diets skyrocketing, more diners are seeking restaurants that cater to their herbivore needs. OpenTable released its 50 Best Restaurants for Vegetarians in America. Featuring restaurants coast-to-coast across 15 states and Washington, D.C., the list includes a variety of cuisines ranging from American to Indian to Mediterranean — perfect for vegetarians everywhere and even omnivores accompanying their veggie-loving friends.
From vegetable-heavy offerings at Nix in New York City to gourmet, plant-based CafeGratitude in San Diego to vegetarian-friendly Mediterranean cuisine at Zaytinya in Washington, D.C., the Best Restaurants for Vegetarians list has it all. With 11 restaurants on the list, New York is the most recognized state, followed by California with nine and Washington, D.C. with seven. Additional states represented include Colorado, Florida, Georgia, Illinois, Louisiana, Maryland, Nebraska, Nevada, North Carolina, Oregon, Pennsylvania, Tennessee and Washington.
"With more and more diners craving veggie-centric cuisine, we're thrilled to provide a list that spotlights restaurants serving standout vegetarian fare across the country," said Caroline Potter, Chief Dining Officer at OpenTable. "Whether you're an affirmed vegetarian or someone looking to explore a sustainable, meatless diet, you can count on finding delicious vegetable-forward dishes at any of these honorees."
The 50 Best Restaurants for Vegetarians list is generated solely from more than 12 million verified OpenTable diner reviews for more than 28,000 restaurants in all 50 states and Washington, D.C.collected between September 1, 2017, and August 31, 2018. All restaurants with a minimum "overall" score and number of qualifying reviews were included for consideration. Qualifying restaurants were then scored and sorted according to the percentage of reviews for which "vegan" and "vegetarian" was selected as a special feature.
Based on this methodology, the 50 Best Restaurants for Vegetarians in America according to OpenTable diners are as follows (in alphabetical order):
50 Best Restaurants for Vegetarians in America
ABC Kitchen – New York, New York
Andina – Portland, Oregon
Âu Lạc Plant-Based Food & Drink – Los Angeles, California
Bar Bombon – Philadelphia, Pennsylvania
Beatrix – River North – Chicago, Illinois
Bistro Aracosia – Washington, D.C.
BLACKOUT – Dining in the Dark – Las Vegas, Nevada
Blind Faith Cafe – Evanston, Illinois
Blossom – New York, New York – Multiple Locations
Brewery Bhavana – Raleigh, North Carolina
Cafe Gratitude – San Diego – San Diego, California
Candle 79 – New York, New York
Catch LA – West Hollywood, California
Charlie was a sinner. – Philadelphia, Pennsylvania
Chauhan Ale & Masala House – Nashville, Tennessee
Delice & Sarrasin – New York, New York
Departure Restaurant and Lounge – Portland, Oregon
Dirt Candy – New York, New York
Divya's Kitchen – New York, New York
Double Zero – New York, New York
Ema – Chicago, Illinois
Equinox – DC – Washington, D.C.
Farmer's Table – Boca Raton, Florida
Farmers & Distillers – Washington, D.C.
Farmers Fishers Bakers – Washington, D.C.
Farmhouse at Rogers Gardens – Corona Del Mar, California
Founding Farmers – Multiple Locations
Gracias Madre – SF – San Francisco, California
Greens Restaurant – San Francisco, California
Harvest Beat – Seattle, Washington
The Helmand Restaurant – Baltimore, Maryland
Irregardless Cafe – Raleigh, North Carolina
Lila – Sarasota, Florida
Linger – Denver, Colorado
The Little Beet Table – New York, New York
Modern Love – Multiple Locations
Nix – New York, New York
Oliver's– Santa Barbara, California
Plant Food + Wine Venice – Venice, California
Planta – Miami Beach, Florida
Rasika – Washington, D.C. – Multiple Locations
Root Down – Denver, Colorado
Sage – A Plant Based Bistro – Culver City, California
Shaya – New Orleans, Louisiana
True Food Kitchen – Multiple Locations
Ulele – Tampa, Florida
Urban Vegan Kitchen (a.k.a. Blossom on Carmine) – New York, New York
XYST NYC – New York, New York
Zahav – Philadelphia, Pennsylvania
Zaytinya – Washington, D.C.
The complete list may also be viewed at https://www.opentable.com/lists/best-vegetarian-friendly-restaurants-2018.
Canada's Best New Restaurants
Thousands of restaurants launch every year, but only ten remarkable destinations can call themselves Canada's Best New Restaurants. Air Canada and presenting partner American Express revealed its highly-coveted Top 10 list with The Restaurant at Pearl Morissette from Jordan, ON, placing atop the list as Canada's Best New Restaurant.
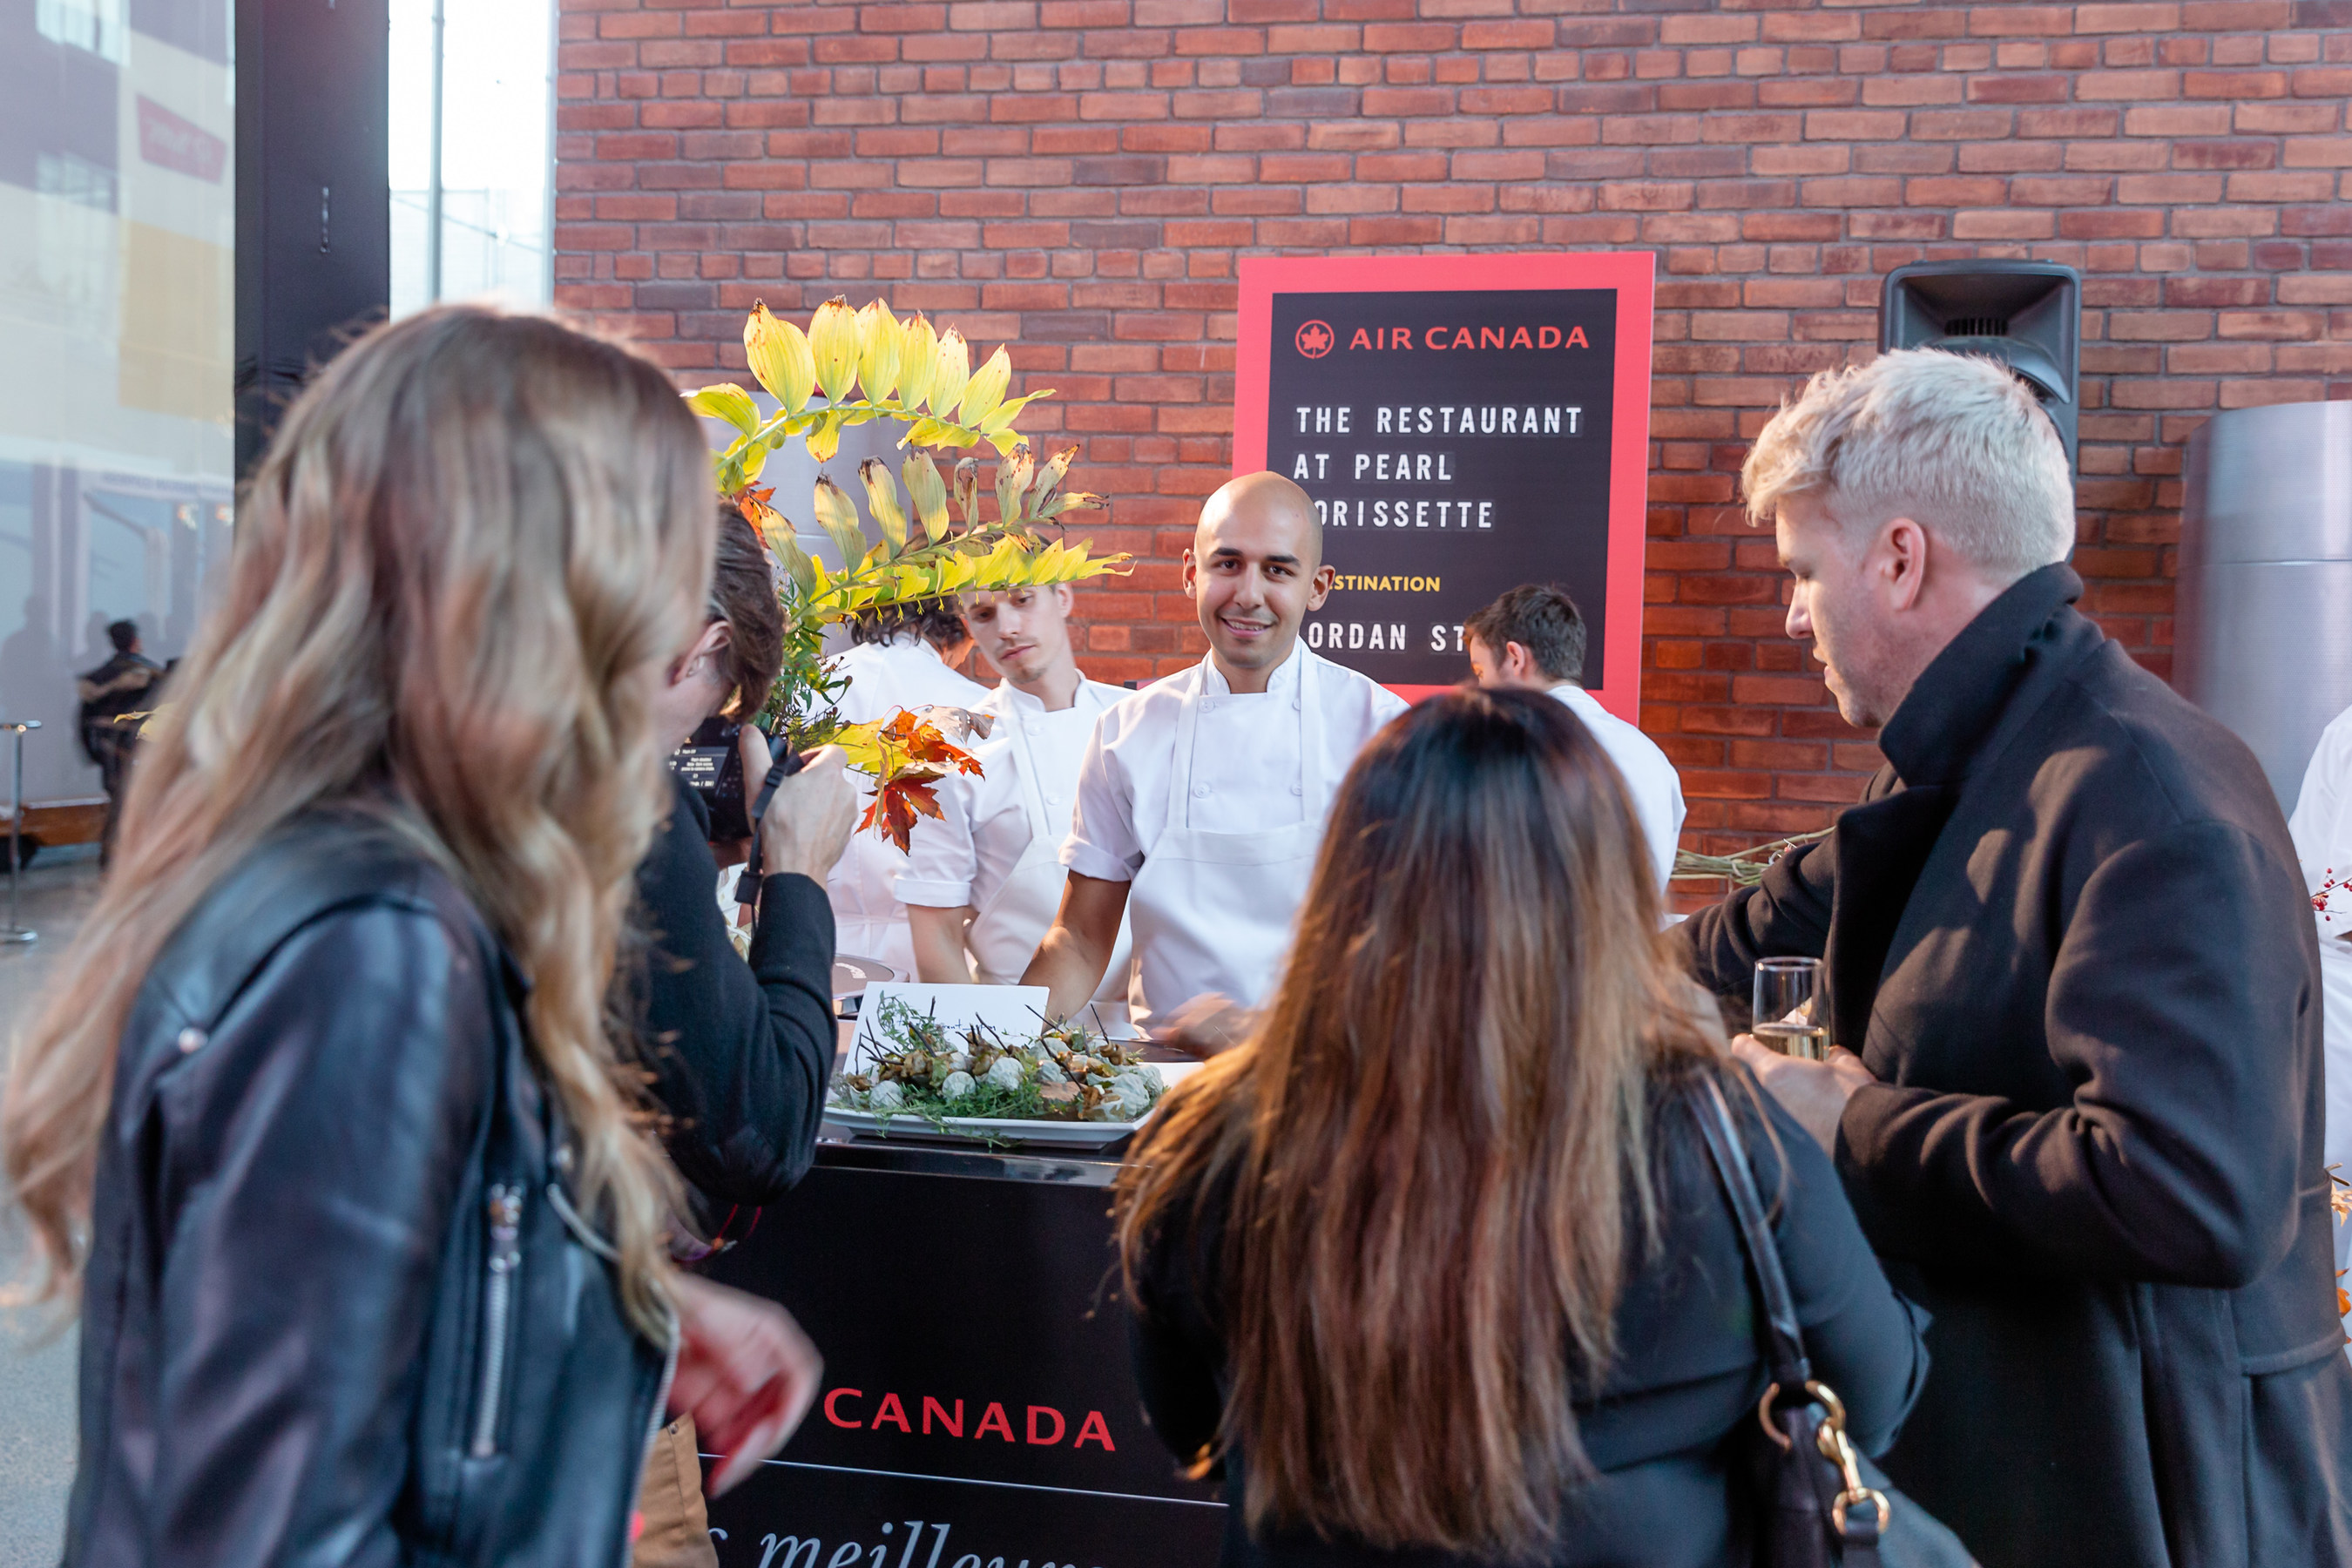
Located in wine country on the Niagara Peninsula, The Restaurant at Pearl Morissette has two chefs who serve an ever-changing, multi-course menu of locally produced and foraged ingredients inspired by seasonal French cooking. Coming in second is wine bar Vin Mon Lapin in Montreal, the latest installment from the city's Joe Beef team. Also hailing from Montreal is this year's third place winner, Italian eatery Elena from the founders of hot spot Nora Gray.
To create the list of Canada's Best New Restaurants, a panel of industry experts considered every new bistro, pub and cafe to generate a delicious selection of restaurants for one writer to visit. This took the writer on a month-long quest from coast to coast to coast, sampling cuisine as diverse as Canada itself. The contest is sponsored by, American Express, Acura Canada, Diageo World Class Canada and Nespresso.
"So many cities across Canada are now recognized as culinary destinations, inspiring both national and international travel. With Canada's Best New Restaurants, Air Canada is shining a well-deserved spotlight on the chefs who make our country one of the most diverse and desirable places to dine," says Andy Shibata, Managing Director, Brand, Air Canada. "For 17 years, Air Canada has celebrated the chefs and innovators who are putting Canada on the map and this year's Top Ten are welcome additions to this highly-coveted club."

"As an ongoing sponsor of Air Canada's Best New Restaurants, we are delighted in this list, which inspires our Cardmembers with such evolution within Canadian cuisine," said David Barnes, VP of Communications and Advertising, American Express Canada. "Canada has an incredible restaurant scene and Amex Cardmembers rely on our brand to give them access to the best restaurants and chefs."
A sense of playfulness and adventure abounds in Canadian restaurants — chefs are serving serious food without taking themselves too seriously. An ice cream sundae is the prized dessert at Aloette, and hoser-classic Labatt 50 is on the drink list at St. Lawrence. Elena's colourful jet-set décor hosts a pizza-focused menu groaning with puns, while Bündok, located in Edmonton's hopping young Ice District, grooves to a killer playlist curated by its snowboarding chef.
Here's the complete list of Air Canada's Best New Restaurants 2018
The Restaurant at Pearl Morissette (Jordan, ON): Atop a massive black barn, the restaurant glows like a landlocked lighthouse on the Niagara Peninsula. The prix-fixe menu features ingredients largely grown or foraged from the surrounding land, with pairings drawn from the winery's holdings and like-minded makers across the globe.
Vin Mon Lapin (Montreal, QC): The green of potted plants dapples the white walls of this Little Italy oasis, where stellar wines playoff layered flavours and textures. This spot serves a dazzling salad of endive, caramelized pumpkin seeds, pickled elderberries and shaved foie gras matches with the creamy minerality of a Loire Valley Domaine du Haut-Planty muscadet, while aromatic Jerusalem artichoke bread topped with sunflower crumble finds a partner in a sunflower butter.
Elena (Montreal, QC): To see what's making Montreal buzz, step into the electric Italian-modern comfort of Elena, a pizza and pasta restaurant from the Nora Gray team. Chow down on pizza showered with six kinds of mushrooms, celery root and taleggio; and handmade tagliatelle with a robust pork and beef ragù.
St. Lawrence (Vancouver, BC): This cozy, teal-panelled spot excels at fat tranches of smoked-ham-studded pâté en croûte accompanied by two kinds of mustard and bottomless crocks of cornichons. A must try is the sautéed sweetbreads with mashed potatoes and morels that are doused with a deep, savoury jus.
Giulietta (Toronto, ON): Sip on low-alcohol amaro spritzes amid Italian-wool-covered walls, the hip and beautiful come to this west-end outpost for its combination of painstaking technique and robust, elegant flavours. They serve up a beautiful plate of fork-tender goat which undergoes a four-hour braise before appearing atop a creamy pool of polenta that tastes both of butter and chicken broth.
Aloette (Toronto, ON): The casual dishes served reveal a serious attention to detail: wedge salad with thin slices of avocado and a sprinkle of crunchy wild rice, pumpkin seeds and soy beans, torched scallops with wasabi peas and a burger enriched with brisket and pungent Beaufort cheese.
Avenue (Regina, SK): The super-tight chef-bartender team behind Ayden in Saskatoon touches down in a city centre heritage building. Their menu consists of tender seared Diefenbaker trout preens on a creamy bed of fresh peas, asparagus and three-grain risotto and a raspberry soufflé.
Bündok (Edmonton): Catch a chef on the rise at this dark-wood-accented downtown space. Don't miss out on their glistening slices of fruity, olive-oil-painted sea bream crudo that are showered with diced apple and Thai basil, brought into vivid relief with orange flecks of bird's eye chili.
Sand and Pearl (Picton, ON): Feast on Fogo Island crab legs, buttery lobster rolls on pain au lait and Manitoulin Island trout niçoise salad that pops with pickled green beans and lemony crème fraîche. Wash them down with Parsons Hula Hoop Sour beer or a Huff Estates pinot gris.
The Courtney Room (Victoria, B.C.): Steak and seafood get dressed up at this serene Victoriasanctuary outfitted with a creative charcuterie cabinet. Their duck breast is aged for two weeks to deepen its flavours, then seared and nestled among Tokyo turnips and braised daikon – perfect with a plummy B.C. Lock and Worth merlot.
Readers can view the full story and find out more about the winners in the pull-out dining guide in the November issue of Air Canada enRoute magazine and online at CanadasBestNewRestaurants.com.
Review Response
Uberall, Inc., announced the results of its “Customer Review Report,” analyzing how consumers evaluate reviews online. For the study, Uberall commissioned a survey of more than 1,000 consumers throughout the U.S. The study was conducted from October 1-5, 2018.
While consumers are the ones posting online customer reviews, brands are closely monitoring what’s being said. But should they actually respond to reviews?
Sixty-five percent of respondents believe that they should respond every time, whether the review is positive or negative. In addition, 18 percent believe they should respond only when the review is negative, while 10 percent feel they should never respond and six percent think they should only respond when the review is positive.
“It’s critical for brands to have a proactive voice in these conversations,” said Josha Benner, Uberall Co-Founder.
When asked how personalized a brand’s responses should be to a customer review, 78 percent said that there should be some personalization. Forty-nine percent said responses should be “somewhat personalized,” while 29 percent said “very personalized.” Just 13 percent said “not very personalized” and 9 percent said “not personalized.”
“People simply aren’t going to be satisfied with a generic response,” Benner said. “Some individualization is required to show that the brand cares about the customer. These results perfectly demonstrate why platforms like Google and Yelp spend so much energy on enforcing that businesses post personal responses versus generic, meaningless ones.”
When asked how likely they would be to pick a location that responds to online reviews, 86 percent said they would be more likely. Of that group, 47 percent said “somewhat more likely,” while 39 percent said “more likely.” Only eight percent said “somewhat less likely” while six percent said “not likely.”
“Consumers prefer businesses who care about them, and it shouldn’t be a surprise that personal responses to reviews show just that to consumers who research a business,” says Benner. “Responding to reviews is great for brand perception which leads to more new customers and repeat business from existing ones.”
When asked how often the survey’s respondents check customer reviews to help them figure out where to go, 57 percent said occasionally, while 19 percent said “all the time.” Seventeen percent said “rarely” and 7 percent said “very rarely.”
“Most people are checking reviews to pick where to go,” said Benner. “Virtually 20 percent are checking them all the time, while almost 60 percent do so with some regularity. I anticipate that there will be greater growth for those who always check, as more brands invest in driving eyeballs to their reviews, given the ROI they can deliver.”
When asked about the importance of online customer reviews, 74 percent cited them as either “moderately important” (40 percent) or “very important” (34 percent). Just 20 percent said “slightly important” and 6 percent said they were “not important.”
“Customer reviews are important, period,” added Benner. “Three-quarters of those surveyed said they were either very or fairly influential. With so many options out there, you live or die based on ratings.”
Nearly 40 percent define positive review as 4.0 and up
The idea of what constitutes a positive review varies. Uberall’s discovered that 39 percent consider “4.0 and up” a positive review. Other responses include: “3.5 and up” (20 percent), “4.5 and up” (15 percent), “5.0” (13 percent), “3.0 and up” (8 percent), “1.5 and up” (3 percent), “2.5 and up” (2 percent) and “2.0 and up” (1 percent).
“A plurality of people think a positive review has to be a 4.0 or up,” said Benner. “This isn’t a surprise. Brands need to keep this in mind when evaluating their online presence. If you have a location with a rating under 4.0, that’s not good enough anymore.”
Pizza and College
Pizza and college go hand in hand, but after you graduate you don’t have to settle for the cheapest possible option. A new study determined the best local pizza place in every city popular among recent grads.
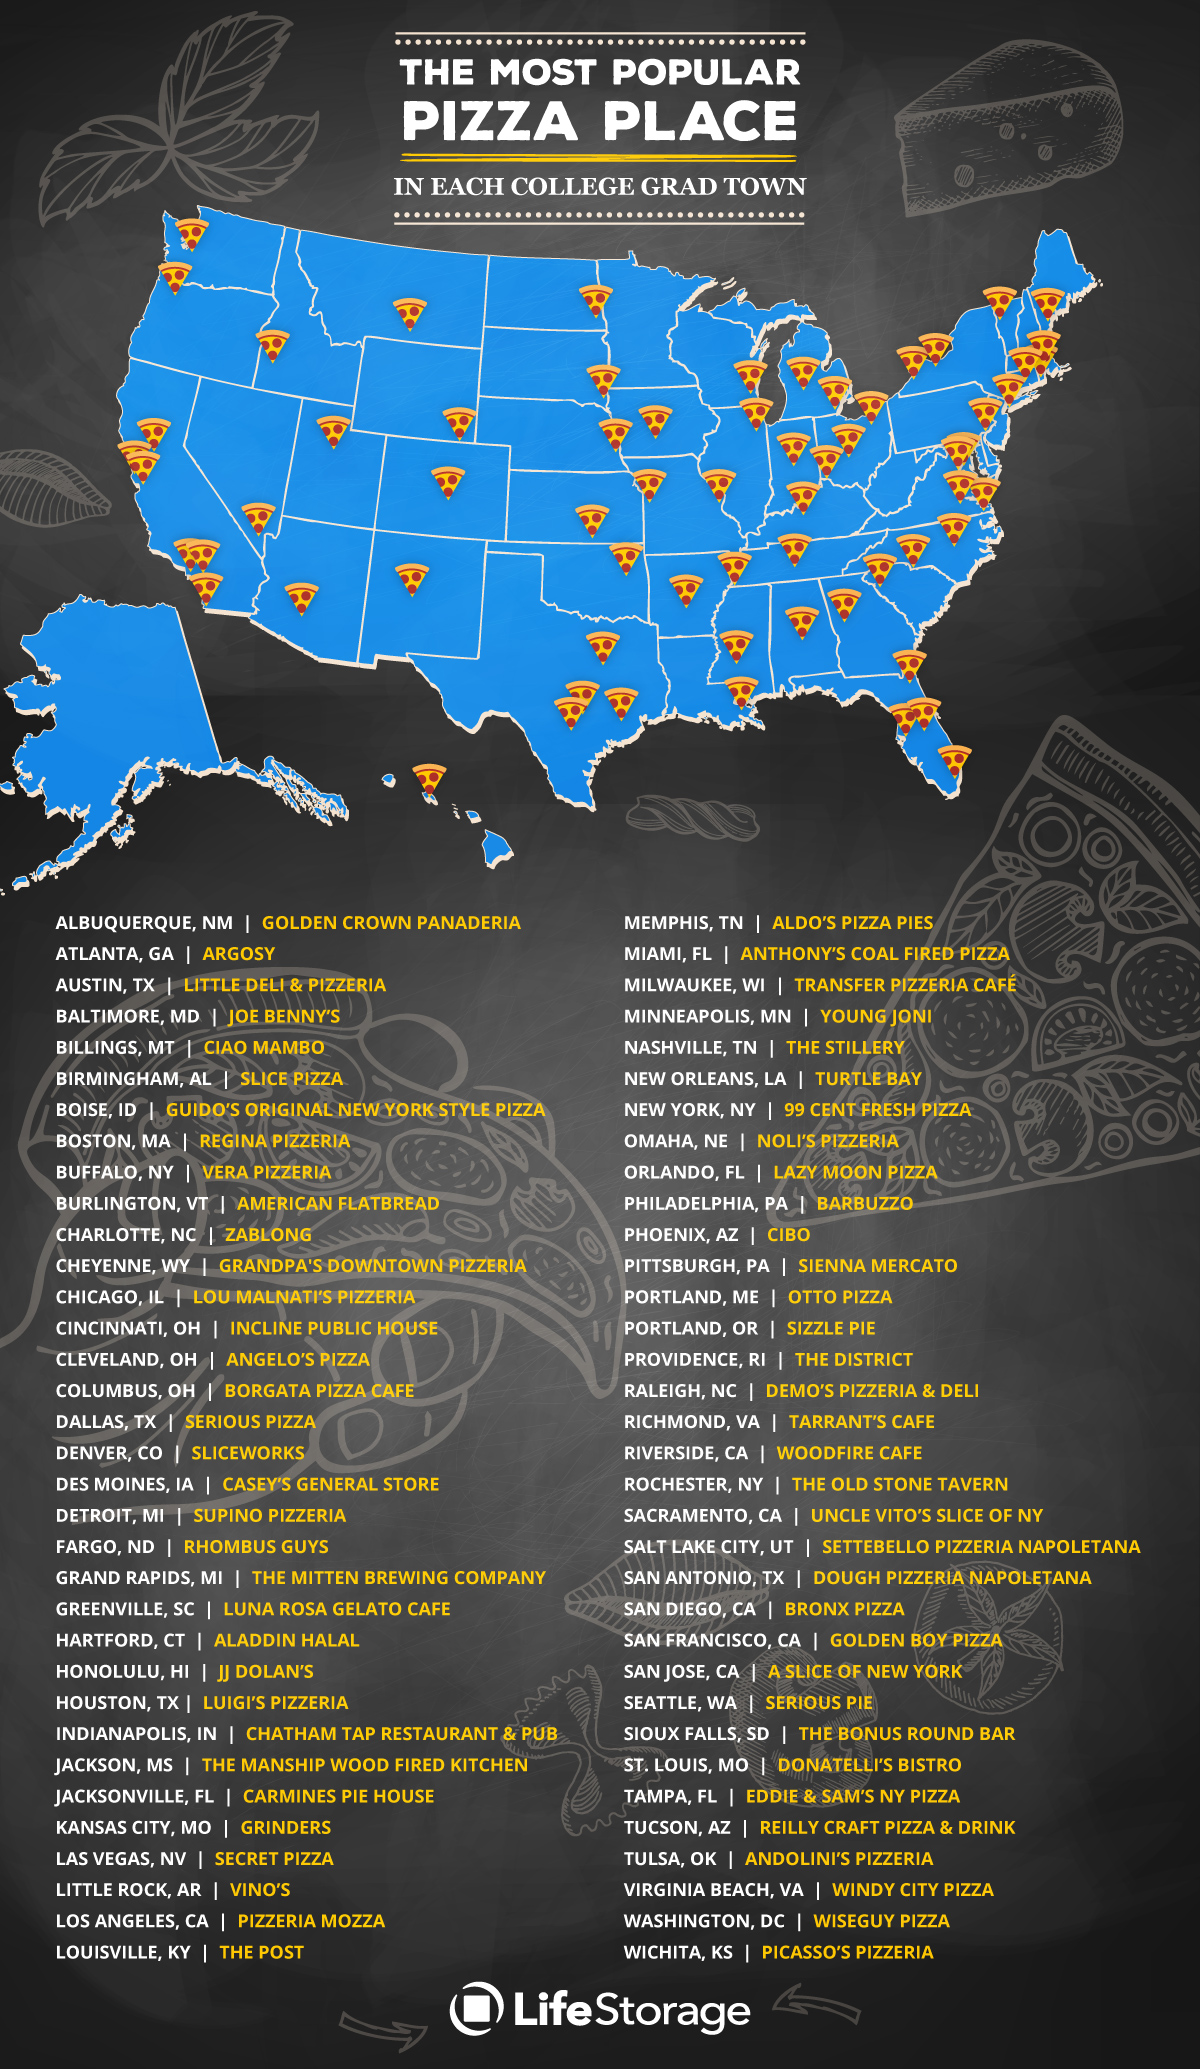
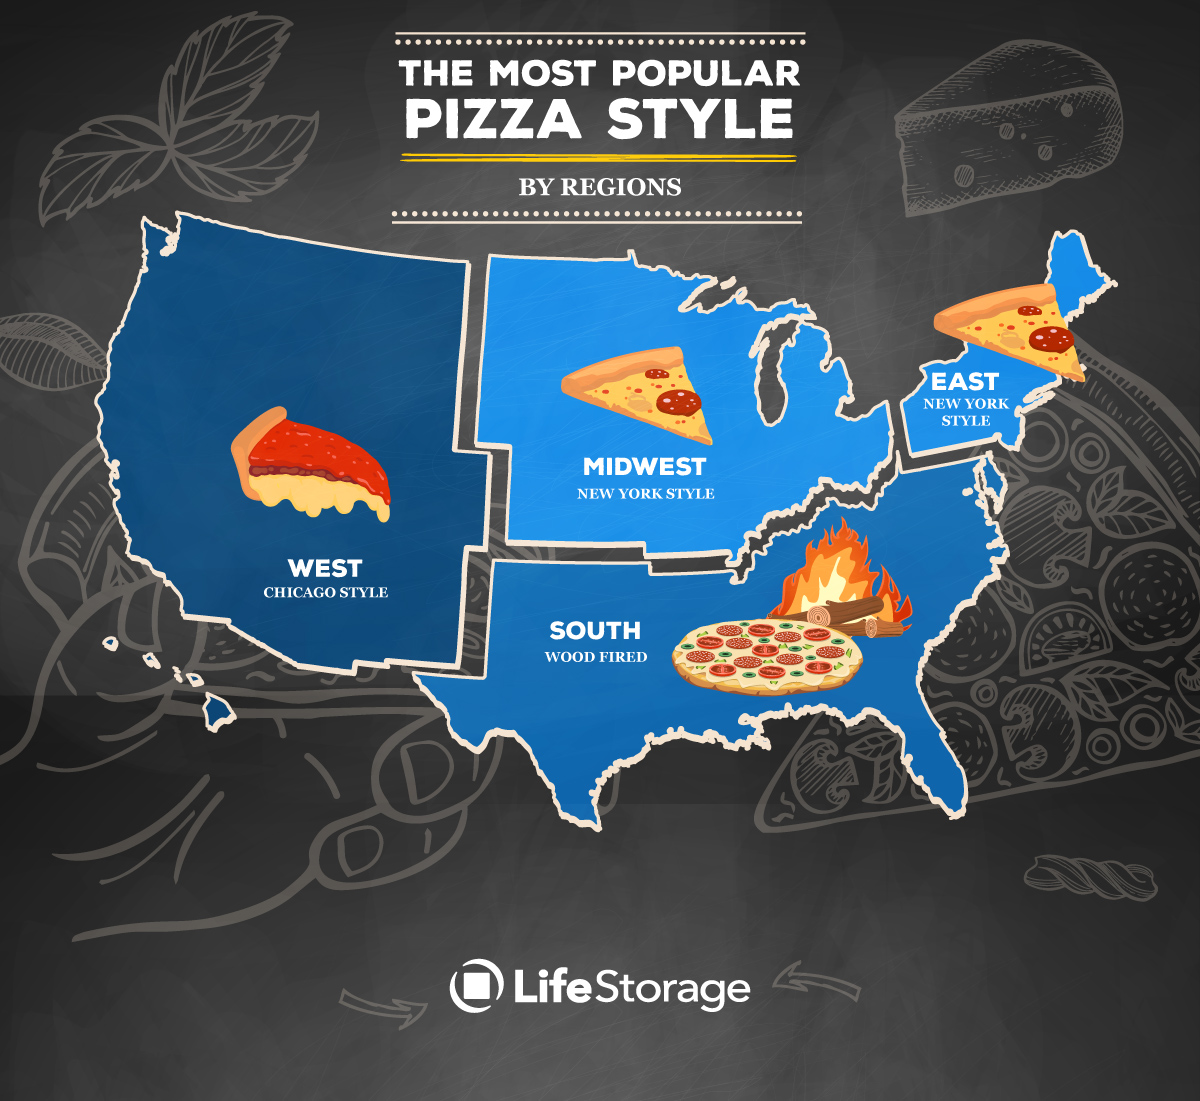
The analysis identified the #1 restaurant based on average Yelp rating, number of reviews, menu cost, and how late it stays open. The results are visualized across the nation as well as by region. The most common styles among the top pizza shops are New York (18 pizza places), wood fired (9), and Neapolitan (6).
Food Trends for 2019
Kroger listed food trend predictions for 2019, curated by its team of Our Brands new product developers, chefs and innovators, focusing on flexible eating styles.
No matter the preference or practice, the latest tastes and trends can be found in the aisles where customers shop for Simple Truth®, Kroger's natural, organic and free-from brand, Kroger®, Where Awesome Meets Affordable™, and Private Selection®, a collection of culinary creations designed to elevate every occasion.
1. Regional Flavors
Foods influenced by regions across the country are bringing flavor and fun to any meal. From tried-and-true barbecue sauces and flavorful potato chips with a twist – inspiration is coming from Nashvillehot chicken, Southern Appalachian pimento cheese and other geographies. America's culinary heritage is as varied as it is delicious. Consumers will see a growing number of products influenced by local, regional and global tastes.
2. Plant-Based Foods
Consumers are finding it is easier than ever before to incorporate more plant-based fare into their daily diets. By electing to go meat or dairy free, whether for a meal, a Meatless Monday, Flexitarian Friday, or every day of the week, there will be more plant-based options available to power through the day. Last year, 31 percent of consumers participated in meat-free days once per week.i
3. Eating Styles
More consumers are purchasing better-for-you products and subscribing to different eating styles, from vegetarian to flexitarian to keto and paleo. A recent study reports 15 percent of the U.S. population identify as vegetarian or vegan.ii Kroger is responding by offering and developing new products that make it easy for any customer practicing any lifestyle to find foods to support their health and wellness journey.
4. Gut-Healthy Foods
Medical studies show that a healthy gut is the foundation of overall wellness, and more than ever before, consumers are seeking foods that support self-care and healthy immune systems. Consumers will find a growing number of products rich in probiotics— good bacteria—and flavor.
5. Low Sugar and Natural Sweeteners
Many consumers are motivated to reduce or eliminate sugar and/or consume alternate natural sweeteners like honey and agave. In fact, 47 percent of consumers say they are working to minimize their sugar intake.iii New solutions and foods will continue to be added to grocery shelves to help consumers find products rich in nutrition and flavor and lean on sugar.
McDonald’s Green Route
McDonald's has embarked on an ambitious plan of designing more than 95 percent of its 1,800 new restaurants in China to meet the ‘LEED’ and ID+C certification standard issued by the US Green Building Council. The move further reinforces the quick-service restaurant giant’s commitment to sustainable growth, says GlobalData, a leading data and analytics company.
According to the company’s 2016 Q3 consumer survey, environmental concerns are now at the forefront of consumers’ minds, with 75 percent of global consumers believing that ‘living an ethical and sustainable lifestyle’ is important or very important to their wellbeing.
Morgane Richert, Senior Foodservice Analyst at GlobalData, said: “The company’s response to customers’ concerns over environmental issues will go a long way in building trust in the brand, by demonstrating that the chain’s green initiatives will be implemented holistically and across global operations.”
Though McDonald’s was once a poster child for environmental and health issues, coming under public pressure from consumers and environmental groups in the late 1980s, it was also the first major foodservice chain to enter into a partnership with Environmental Defense Fund to reduce packaging and waste.
Through these efforts, McDonald’s eliminated more than 300 million pounds of packaging and reduced restaurant waste by 30 percent over the following decade.
Since then, McDonald’s has continued to establish itself as a leader in environmental practices, setting standards for the foodservice industry as a whole. This is, in turn, incentivizing its competition to follow suit and treat sustainability as an essential component of strategy and planning for the future.
Earlier this year McDonald's announced its intention to get 100 percent of its packaging from renewable, recycled or certified sources by 2025.
In July 2018, McDonald’s and Starbucks indicated that they would team up with Closed Loop Partners to develop a cup that could be mass produced from recyclable and/or compostable materials.
Richert concludes: “This shows that, in matters of environmental protection and sustainability, even the fiercest industry rivals are ready and willing to join forces and resources for the common good, a move that will benefit the entire industry, while also boosting both brands’ image and reputation among consumers.”
Driverless Car Disruption
Driverless cars will disrupt the food and drinks industries in the next ten years, according to a new future-focused service from industry websites just-food and just-drinks.
The inaugural FUTURES report has found that the use of autonomous vehicles in grocery delivery will change the look and feel of food and drinks products as packaging evolves to become smart and lightweight. However, as part of the in-depth analysis, auto industry experts warned that the technology needed to make driverless vehicles an everyday reality is still a way off.
Key findings in the report include:
- Driverless vehicles will cut last-mile delivery time and cost, changing the way consumers shop
- Food and drinks companies will need to rethink packaging, online presence and retailer relationships
- Kroger, Walmart and Ocado are ahead with driverless delivery trials
- Consumers are already enthused by the prospect of driverless grocery delivery
The report explores the current pilot schemes between retailers and autonomous car firms and the mega trends propelling the move towards automated grocery delivery. The report also features consumer insights experts and their work examining how people feel about the prospects of 'last yard' delivery as well as specialist insight from the auto industry on the reality of driverless vehicles.
Speaking about the new report, FUTURES editor Lucy Britner said: "The prospect of fully-automated vehicles delivering grocery products directly to our homes may be a few years away, but as more and more retailers begin to invest in pilot schemes it is important to look at how food and drinks companies can start to prepare.
"This is the first in a series of future insights reports, designed to look at what will disrupt the food and drinks industries and offer insight into what businesses can start to do now."
FUTURES was launched in October 2018 by just-food & just-drinks' parent company Aroq. Starting with a series of digital magazines, the FUTURES service will cover everything from new technologies to emerging consumer trends.
Aroq CEO Richard Jackson said: "We live in a time of unprecedented and rapid change. It is becoming more challenging than ever for businesses to navigate their way through disruption.
"We have launched the FUTURES service to help the food and drinks industries look beyond the five-year horizon and prepare for doing business in a whole host of new environments."
Do Paper Towel Dispensers in Public Restrooms Waste More Product than Necessary?
Nearly three in five Americans (57 percent) believe paper towel dispensers in public restrooms usually waste more product than necessary, according to a recent survey commissioned by Sofidel, a leading global provider of paper for hygienic and domestic use. The survey was conducted online by The Harris Poll from August 17-23, 2018 among 2,038 U.S. adults ages 18 and older and also revealed how many Americans admit to using more paper towels than necessary.
“The overuse of paper towels is a common occurrence in public restrooms today, as many dispensers aren’t designed to curb waste,” said Fabio Vitali, Vice President AFH Marketing & Sales for Sofidel America. “When restroom guests take more paper towels than is necessary for effective hand drying, the cost of day-to-day operations and restroom maintenance increases. This simple problem can be easily addressed with a product that limits paper towel use to one sheet per pull.”
The survey also found that about 1 in 4 Americans (24 percent) say they take more paper towels than needed when using paper towels to dry their hands in a public restroom. Men are more likely than women to take excess paper towels, with 29 percent saying they had taken more paper towels than needed, while only 20 percent of women have done so.
This survey was conducted online within the United States by The Harris Poll on behalf of Sofidel from August 17-23, 2018 among 2,038 U.S. adults ages 18 and older. This online survey is not based on a probability sample and therefore no estimate of theoretical sampling error can be calculated. For complete survey methodology, including weighting variables and subgroup sample sizes, please contact jmessenger@mulberrymc.com.
Global Food Flavors
Rise in consumer demand for food flavors across emerging economies and increase in technological developments to formulate new flavors would propel the growth of the global food flavors market
Allied Market Research published a report, titled, "Food Flavors Market by Type (Natural and Artificial) and End User (Beverage, Savory & Snack, Bakery & Confectionery, Dairy & Frozen Product, and Animal & Pet Food): Global Opportunity Analysis and Industry Forecast, 2018-2025". The report offers in-depth insights on the key investment pockets, top player positioning, drivers & opportunities, major market segments, strategic developments, and competitive landscape. According to the report, the global food flavors market was pegged at $13.17 billion in 2017 and is expected to reach $20.11 billionby 2025, registering the CAGR of 5.4 percent through 2025.
Rise in consumer inclination toward natural food products and increase in novel ways to develop innovative formulations such as natural food flavors extracted from exotic fruits drive the growth of the global food flavors market. In addition, adoption of new and advanced technologies such as solid-liquid extraction (SLE) and supercritical fluid extraction for easy extraction have supplemented the market growth. However, stringent government regulations and adverse effects of synthetic flavors on human health hamper the market growth. On the other hand, innovations in flavors and surge in demand across emerging economies are expected to create lucrative opportunities for the market players in the coming years.
The natural food flavors segment is anticipated to manifest the fastest CAGR of 9.0 percent from 2018 to 2025, owing to rise in demand for unique & exotic flavors, unusual flavor combinations, and awareness regarding the side effects of artificial flavors such as dizziness, nervous system depression, fatigue, nausea, and others. However, the artificial food flavors segment held the largest market share, contributing more than half of the total market revenue in 2017.
The savory & snacks segment is expected to register the fastest CAGR of 6.3 percent during the study period, owing to rise in prevalence of ethnic drinks and food products and westernization of diets in the emerging countries. However, the beverages segment held the largest market share in 2017, contributing about 25 percent of the total revenue, owing to technological advancements in manufacturing processes and rise in demand for fruit-flavored drinks. The other segments analyzed in the report include dairy & frozen products, bakery & confectionery, and animal & pet food.
Asia-Pacific region accounted for about one-third share of the market, owing to rise in consumption of beverages, dairy, confectionery, and bakery products in the region. However, Latin America would portray the fastest CAGR of 6.1 percent during the forecast period, owing to increasing demand for safe and effective natural flavors and growing acceptance for natural flavors among consumers. The other regions analyzed in the report include North America, Western Europe, Eastern Europe, Middle East, and Africa. The key market players analyzed in the report are Kerry Group, Plc., Firmenich, Sensient Technologies Corporation, Hasegawa Co. Ltd., Takasago International Corporation, Huabao International, Givaudan, Symrise AG, Frutarom Industries, International Flavors & Fragrances Inc., and Wild Flavors. These players have adopted various market strategies such as partnerships, collaboration, mergers & acquisitions, new product launch to strengthen their foothold in the industry.
Smaller Size is Fun
With fun-sized chocolate and candy flying off the shelves as Halloween creeps up this week, it seems Americans are looking for more ways to treat themselves to bite-sized chocolate year-round. Just in time for Halloween, new research from Mintel reveals that US chocolate buyers* are most likely to say they would like to see more chocolate in mini-sized bars or bites (49 percent). Although nine in 10 (90 percent) chocolate buyers agree that it’s okay to indulge occasionally in chocolate, 63 percent say it’s important to limit chocolate consumption. Fun-sized varieties could be just what consumers are looking for to help them cut back as three quarters (75 percent) say that single-serving or bite-sized chocolate is a good way to do so.
While nostalgia has 63 percent of chocolate buyers reaching for the same kinds of chocolate today that they did as a kid to satisfy their sweet tooth, there is an opportunity for premium and innovative varieties to own a larger share of the market. More than three quarters (76 percent) of chocolate buyers say that it’s worth it to pay a little more money for premium chocolate. What’s more, among the top types of chocolate products chocolate buyers would like to see more of are unique sweet flavors (31 percent), savory flavors (29 percent) and those with functional benefits such as truffles with good fats (30 percent) and added protein (18 percent).
Overall, total US retail sales of chocolate confectionery are estimated to have grown 15 percent since 2012 to reach $18.5 billion in 2018. Seasonal chocolate is the fastest growing segment, with sales forecast to reach $3.9 billion in 2018 and growing 29 percent since 2012.
“Chocolate confectionery is available in nearly infinite forms, flavors and combinations, but many chocolate purchasers gravitate to what they know. While bite-sized chocolate may get credit for being a good way to limit consumption, the munchability and shareability of mini-sized products might actually make the form a good way to drive increased consumption with consumers reaching for an extra handful. Chocolate’s continued sales growth signals that consumers remain open to small treats, even as they strive to eat healthier overall. Its status as a permissible indulgence and unique craveability give chocolate ample room for further growth and premiumization,” said John Owen, Senior Food and Drink Analyst at Mintel.
Americans are Eating More Chocolate and Less Candy in 2018
It seems Americans will be indulging in less candy (non-chocolate confectionery) and more chocolate this Halloween. While chocolate buyers are more more likely to say that they’re buying more chocolate in 2018 than a year ago (21 percent vs 17 percent buying less), candy may be making it into less trick or treat bags. More than one quarter (27 percent) of non-chocolate confectionery consumers say they’re eating less candy today than last year (vs 15 percent eating more).
While reducing sugar (61 percent) and calories (44 percent) are the leading reasons why consumers are eating less candy, they are embracing the category’s indulgent side. In fact, non-chocolate confectionery eaters are more than twice as likely to say that it’s important for non-chocolate candy to look indulgent (33 percent) than for it to be low/no sugar (14 percent). For many, ignorance is bliss when it comes to candy’s healthfulness as under one in five (18 percent) candy eaters say they read the nutritional information on non-chocolate confectionery.
Health concerns aside, it seems most kids across the country will get to indulge in their hard-earned candy this Halloween. Mintel research reveals that less than half (42 percent) of parents who eat candy say that they limit the amount of candy that their kids eat. Parents of younger kids are keeping a more watchful eye as the percentage rises to 53 percent of parents of kids aged 5 and under.
“Halloween is universally known as a holiday where kids and parents alike indulge their desire for sweet treats, but our research shows that many consumers are shifting away from candy due to health concerns. While the majority of parents aren’t keeping a strict watch over their kids’ candy consumption, many are looking for some help in making smarter choices for their kids. Chocolate and non-chocolate confectionery options that are sweetened with fruit and/or made with more natural formulations could become more comfortable go-tos for parents,” continued Beth Bloom, Associate Director, Food and Drink, at Mintel.
Chewy Candy Innovation
Despite the fact that some consumers are eating less candy, product innovation has helped the category see sales growth over the last six years. Total US sales of non-chocolate confectionery are estimated to have grown 15 percent since 2012, reaching an estimated $8 billion in 2018, driven by chewy candy—the fastest growing segment. Sales of chewy candy are estimated to reach $4.3 billion in 2018, a 36 percent increase since 2012. New product development has helped the chewy candy segment see sales rise as new product launches of chewy candy in the US grew 83 percent over the last five years**, according to Mintel Global New Products Database (GNPD).
“Sales growth in the non-sugar confectionery category has slowed over the past five years as health concerns rise, but has stayed afloat as consumers continue to value the indulgent side of candy. Chewy candy specifically has sugar coated the category’s slowed growth as a result of strong innovation efforts from brands in the segment. To increase consumption, non-chocolate confectionery brands should focus efforts on encouraging permissible indulgence through sugar reduction and adding premium offerings, such as new flavors and textures, to their product lineup,” concluded Bloom.
Chocolate Cravings
Leading market research firm Packaged Facts estimates total retail dollar sales of the U.S. chocolate candy market will reach $23 billion in 2018, with sales increasing at a compound annual growth rate (CAGR) of more than 2 percent between 2013 and 2018. The market estimates are featured in the recently published report Chocolate Candy: U.S. Market Trends and Opportunities, 12th Edition. The report is the first in a trio of studies by Packaged Facts on the U.S. confectionery market, including upcoming reports on chewing gum and non-chocolate candy.
"The chocolate market is indisputably dynamic with a strong pace of innovation, an influx of creative new players, and a steady flow of new products that engage diverse groups of consumers," says David Sprinkle, research director for Packaged Facts. "There remains consumer devotion to confectionery products and the role of chocolate candy in particular as an accessible luxury, creating many opportunities to trade consumers up to premium products."
Indeed product premiumization has emerged as a key driving force in the industry's growth, especially as consumers have discovered the ever expanding selection of premium, indulgent confectionery products available online.
"Online shopping is truly the new playground for premiumization," says Sprinkle. "Shifts in shopping behavior such as self-checkout and online purchasing have potentially dampened the types of in-store impulse purchases that traditionally drive a high level of chocolate sales. However this is offset to an extent by ecommerce increasing the availability and purchasing of specialty products including local, nostalgic, and premium gift chocolates."
As to be expected, seasonality also influences consumer purchases of candy and other snack foods. Sales typically spike around holidays due to the common practice of gifting and consuming snacks as part of these celebrations. These factors, coupled with a steadily rising population, confer stability to a U.S. chocolate candy market that is mature yet growing. Packaged Facts estimates that Holiday/Seasonal chocolates account for about a quarter of the market's sales. Easter is the largest segment followed by Christmas, Valentine's Day, and Halloween.
Tableware Demand
US demand for tableware and kitchenware is projected to increase 1.3 percent annually in nominal terms through 2022, according to Tableware & Kitchenware: United States, a report recently released by Freedonia Focus Reports. Increased interest in at-home cooking, partially driven by meal kit services, will boost revenues. Continued growth in disposable personal income, foodservice industry revenues, new marriages, household formation, and home sales will also contribute to gains. However, a highly competitive market caused by the entrance of several new companies utilizing a direct-to-consumer business model will limit further growth.
Demographic trends will represent a key driver of sales over the forecast period. Increases in the 25-to-34-year-old age group will benefit the market for tableware and kitchenware products, as this segment represents the largest share of new households and marriages, and includes first time homebuyers. An increase in 55-64 year-olds will further support gains, as members of this age group possess higher levels of disposable income than the broader population, supporting replacement purchases. In addition, this group purchases second homes at a relatively high rate, further driving sales.
These and other key insights are featured in Tableware & Kitchenware: United States. This report forecasts to 2022 US tableware and kitchenware demand and shipments in nominal US dollars at the manufacturer level. Total demand and shipments are segmented by product in terms of:
- plasticware
- metalware
- glassware
- ceramicware
- woodware
To illustrate historical trends, total demand, total shipments, the various segments, and trade are provided in annual series from 2007 to 2017.
The products covered in this report constitute items used to prepare, serve, consume, and store food. Dinnerware made of solid bleached paperboard or polystyrene foam is excluded from this report, as well as cast-iron cookware. Re-exports of tableware and kitchenware are excluded from demand and trade figures.
Playing Politics
Grocers should stay out of politics. That is one of the main takeaways from TrendSource’s recently-released 2018 Grocery Industry Report which found that grocers are nearly ten-percent likelier to take a hit from supporting a candidate that consumers oppose than they are to get a boost from supporting one consumers also support.
Indeed, consumers’ opinion of stores is more significantly impacted when the store’s politics clash with their own than when they align.
Obviously, in this politically-charged moment, grocers and other retailers face questions about the intersection of politics, ethics, and commerce, but TrendSource’s data suggests the answer should be easy. With consumers nearly ten-percent likelier to be negatively influenced by grocers’ political alignments than positively, the math is simple—politics doesn’t pay.
The report, which surveyed 1,116 US consumers in May and June of this year offers generational, income, dietary, gender, and community segmentations, offering some further insights into this political question.
For example, a store’s politics matter more to respondents who self-identify as urban than it does to those who self-identify as rural. There can be many potential explanations for why urban respondents were ten percent likelier to react to grocers’ political alignments than their rural counterparts, but regardless of reasoning, stores should stay out of politics in both community types.
In addition to the political question, the report offers in depth analysis of current omnichannel grocery trends. Topics include:
- Adoption rates for omnichannel grocery services such as delivery and click and collect
- Consumer preferences regarding in-store checkout options including self-checkout, traditional cashier-assisted checkout, and no checkout at all a-la Amazon Go
- The main drivers that bring consumers, particularly millennials, into brick-and-mortar locations
- The different ways men and women engage the in-store shopping experience
- The shortcomings digital grocery must overcome to truly surpass traditional in-store shopping
Download the full report here.
Demand for Portion-Control Salad Dressing
Foodservice delivery sales grew by 20 percent over the past 5 years and riding on this boom is portion-control salad dressing, a delivery order staple. Gallons of portion-control salad dressing shipped by broadline foodservice distributors to commercial restaurants increased by 17 percent in the year ending June 2018 compared to same period year ago, reports The NPD Group.
Not surprisingly portion-control salad dressing had its highest gains through the quick service channel, which represents over 80 percent of foodservice delivery orders. Gallons of portion-control salad dressing shipped to quick service outlets increased to 26 million gallons in 2017, driven by gains at large QSR chains, according to NPD’s Foodservice Future Views, which sizes operator foodservice purchases by product categories.
Ranch-homestyle and ranch-buttermilk are among the two most popular dressing flavors and both grew by double-digits, as did Vinaigrette-balsamic and Caesar. By label type, operator and manufacturer labels represent the largest share of portion-control salad dressing shipped, with operator label providing the steepest growth of the two. Additionally, some brands offering portion-control salad dressing realized double-digit gains in gallons shipped.
“Portion-control salad dressing is one example of the categories benefiting from the foodservice delivery boom,” says Annie Roberts, vice president, SupplyTrack, The NPD Group. The U.S. online ticketing market size is anticipated to reach USD 6.23 billion by 2025 due to increasing penetration of smartphones and rising disposable income levels. In addition, growing number of Internet users in the country is likely to have a positive impact on market growth over the next few years.
Rapidly growing entertainment and sports industries in the country is bolstering the U.S. online ticketing market. Furthermore, the industry is projected to benefit from decline in offline modes of shopping and booking tickets. Shifting consumer preference from offline to online methods, due to various benefits such as time and cost saving, is also contributing toward market development.
Online Ticketing Forecast
Growing interest of investors in mobile application development for improved consumer experience and convenience is likely to provide many opportunities for the U.S. online ticketing market. Increased usage of social media platforms is also projected to spur market development as these platforms enable ticket booking process using integrated ticket system, making online shopping more convenient and easier. This scenario is expected to boost market growth in U.S.
The online ticketing industry is projected to expand at a healthy CAGR owing to major shift from paper tickets to online ticketing options. The industry is segregated into three main categories comprising of music concerts and events, sports events, and others. The others segment, which consists of movies and other recreational activities, led the overall market owing to rapid growth in the entertainment sector.
Online ticketing platforms offer users detailed information about locations, most suitable prices, and availability of seats without any inconvenience. Due to all these advantages, more people are opting for online ticketing systems, which, in turn, drives growth. Availability of digital payment options is also playing a crucial role in market expansion.
Some of the prominent companies operating in the U.S. online ticketing market are Ticketmaster Entertainment, Inc.; Live Nation Worldwide, Inc.; StubHub; MovieTickets.com, LLC.; and Razorgator. These companies are concentrating on various marketing strategies, e.g. offering additional services, in order to improve sales. For instance, Movietickets.com allows its customers to discover nearby movie theaters. Live Nation not only provides online ticketing options but also provides time and venue details for approaching events organized across the globe.
Social Media Impact
People tend to use social media – particularly YouTube and Instagram – more in 2018 compared to 2017, according to a new survey from The Manifest, a business news and how-to website.
Nearly two-thirds of social media users report they use YouTube (63 percent) and Instagram (61 percent) more in 2018 than 2017, compared to 52 percent who say they use Facebook more this year.
“Instagram and YouTube have very strong user bases,” said Charlotte Chipperfield, founder and CEO of Chipperfield Media. “[These channels] serve as entertainment platforms first.”
Although people use YouTube and Instagram more often this year, most people still use Facebook at least once a week.
Eighty-two percent (82 percent) of people use Facebook, compared to 75 percent who use YouTube and 53 percent who use Instagram.
Facebook is powerful as a social media channel because it is one of the oldest and most-established channels.
“[Facebook] has been defaulted to people’s home on the internet; it’s the other internet,” said Josh Loewen, digital marketing director of The Status Bureau, a digital marketing agency in Vancouver. “When people think of where to go and what media to consume, they go to Facebook.”
Facebook remains popular, but YouTube and Instagram’s usage is growing.
Social media is part of most people’s everyday lives: 86 percent use it daily, and 72 percent use it multiple times per day.
“Social media is a large part of everybody’s life,” Loewen said. “It’s how people communicate, look for events, notice stores and brands, and find the weather. It’s how people are aided in their daily life.”
People use multiple methods to access social media – mobile, computer, and tablet apps in addition to web browsers and smartwatches, but the most popular are mobile apps and computer web browsers.
Most social media users access social media from mobile apps (67 percent) and computer web browsers (57 percent).
“We have our phone on us at all times and our computer in front of us the other part of the time,” Loewen said. “They’re both really accessible mediums.”
Seventy-five percent (75 percent) of women use social media multiple times per day, compared to 64 percent of men.
This is attributed to the greater appeal social media has to women and their interests, experts say.
“The amount of content out there on the internet and on social entertain women more than they would men,” said Joseph Rothstein, account manager at Social Media 55.
The Manifest’s 2018 Consumer Social Media Survey included 627 people in the U.S. who use social media at least once per week.
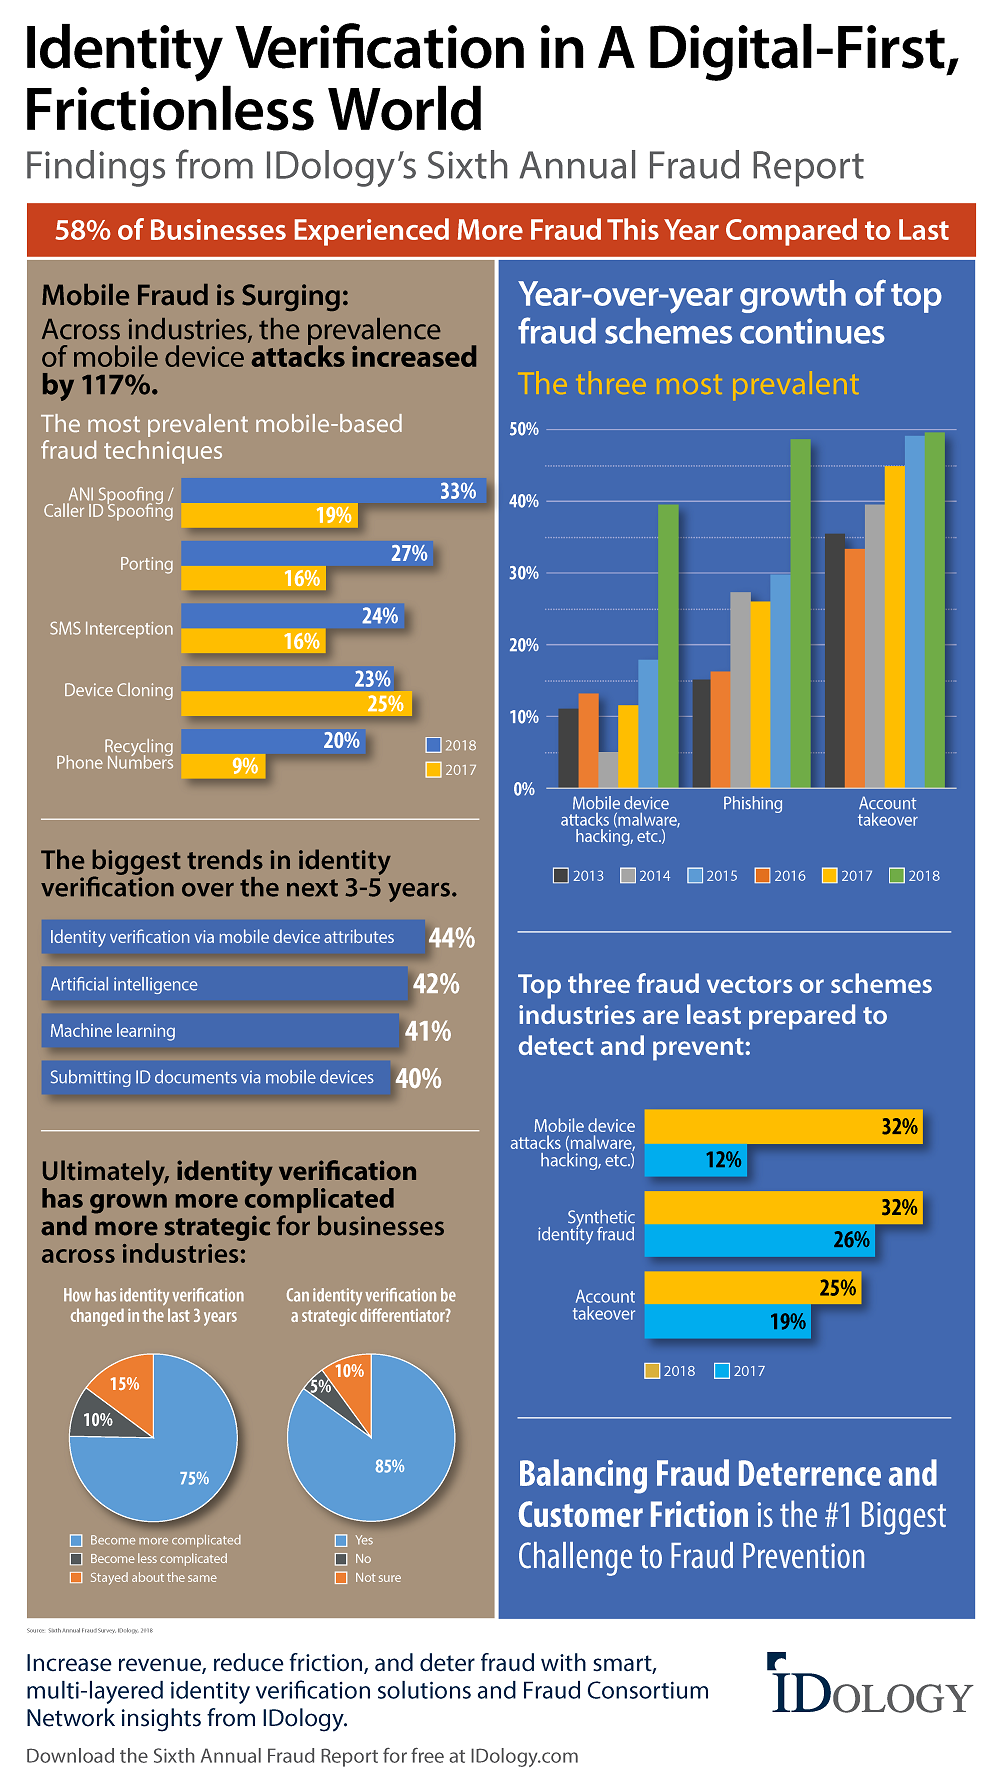
Fraud Prevention
IDology, a pioneer and trusted leader in identity verification, authentication and fraud prevention, today released its Sixth Annual Fraud Report, confirming the growing importance of balancing customer friction and fraud prevention, cited by businesses this year as the number one challenge in fighting fraud. The report reveals a surge in mobile and phishing fraud schemes, a focus on artificial intelligence and machine learning as the growing trends in identity verification, and the strategic role identity verification plays in the quest to gain a competitive edge, retain and attract customers, and increase revenue.
"The prevailing mindset that in order to keep fraud out, the customer verification process has to be made more difficult is quickly becoming outdated," said John Dancu, CEO of IDology. "In our modern connected world, it's no surprise that fraud is on the rise and becoming more sophisticated. Winning businesses will be the ones that take a strategic approach to identity verification with the realization that they can offer frictionless customer convenience and effective fraud deterrence to ultimately cultivate customer trust."
Credit card fraud and account takeovers remain the most widespread forms of fraud, but phishing schemes and mobile fraud have surged.
The prevalence of mobile fraud surged dramatically with an increase of 117 percent over the previous year (one of the highest year-over-year increases among the fraud vectors measured this year in the survey). The number of businesses that feel their industry is least prepared to detect and prevent mobile device attacks increased 167 percent compared to a year ago.
Businesses reported a 63 percent increase in mobile fraud. All types, including porting, spoofing, hacking and fraudulent change events, are on the rise. Caller ID spoofing increased by 74 percent, porting by 69 percent and SMS interception by 50 percent compared to 2017.
Phishing, which can be linked to 93 percent of last year's security breaches and has steadily risen each year, increased in prevalence by 66 percent.
"We are at a crossroads where the movement to mobile meets high consumer expectations and sophisticated fraud schemes," said Julie Conroy, research director for Aite Group's Retail Banking & Payments practice. "Identity verification is now something that businesses must consider as a key strategic factor for market differentiation and growth. A seamless, comprehensive and multi-layered approach with an anti-fraud consortium network of companies across industries is now table stakes."
This year's Fraud Report provides an inside look at what U.S. businesses have learned about fraud detection and prevention, and how they view the changing landscape. A few highlights:
Once thought of as a compliance checkbox measure, 85 percent of businesses now consider identity verification a strategic differentiator due to rising, more sophisticated forms of fraud, competitive pressures and consumer expectations for fast, easy digital onboarding.
For 75 percent, identity verification has become more complicated in the last three years. Companies are realizing the need to move toward more robust and comprehensive multi-layered identity verification solutions that examine a full spectrum of identity attributes.
They see the utilization of mobile device attributes for verification, artificial intelligence, machine learning and mobile document capture as the most impactful new trends in identity verification.
Across industries, businesses feel particularly unequipped to handle synthetic identity fraud, mobile fraud and account takeovers.
For additional insights into fraud trends across a variety of industries and firsthand perspectives shared by executives on the front lines of fraud prevention, download the full Sixth Annual Fraud Report. Now in its sixth year, the report captures the impact of fraud on leading companies across multiple industries including financial services, healthcare, insurance and ecommerce. Respondent titles and areas of responsibility include senior leadership, vice presidents, directors, managers and analysts in risk, fraud, compliance, product and operations departments.