
MRM Research Roundup: Mid-February 2019 Edition
17 Min Read By MRM Staff
This edition of Modern Restaurant Management (MRM) magazine's Research Roundup features news on the appeal of the color red at Valentine's Day from Baldor Specialty Foods, the best cities to open a restaurant from Bid on Equipment, restaurant loyalty and top bagel loving cities.
The Appeal of Red Produce
The experts at Baldor Specialty Foods noted the increase in sales of red produce in the two weeks leading up to Valentine's Day. From pink dragon fruit to baby beets, to Radicchio Rosa, sales have shown to increase from 100- 300 percentin just two weeks leading up to this special day.
- Sales on Radicchio Rosa Digorizia increased by 198 percent
- Sales on Red baby beets increased by 159 percent( peeled increasing by 333 percentand unpeeled increasing by 152 percent)
- Sales on Blood Oranges increased by 112 percent
- Sales on Passion Fruit increased 103 percent
- Sales on Red Grapefruit increased by 250 percent
- Sales on Red Watercress increased by 156 percent
- Sales on Red Romaine increased by 114 percent
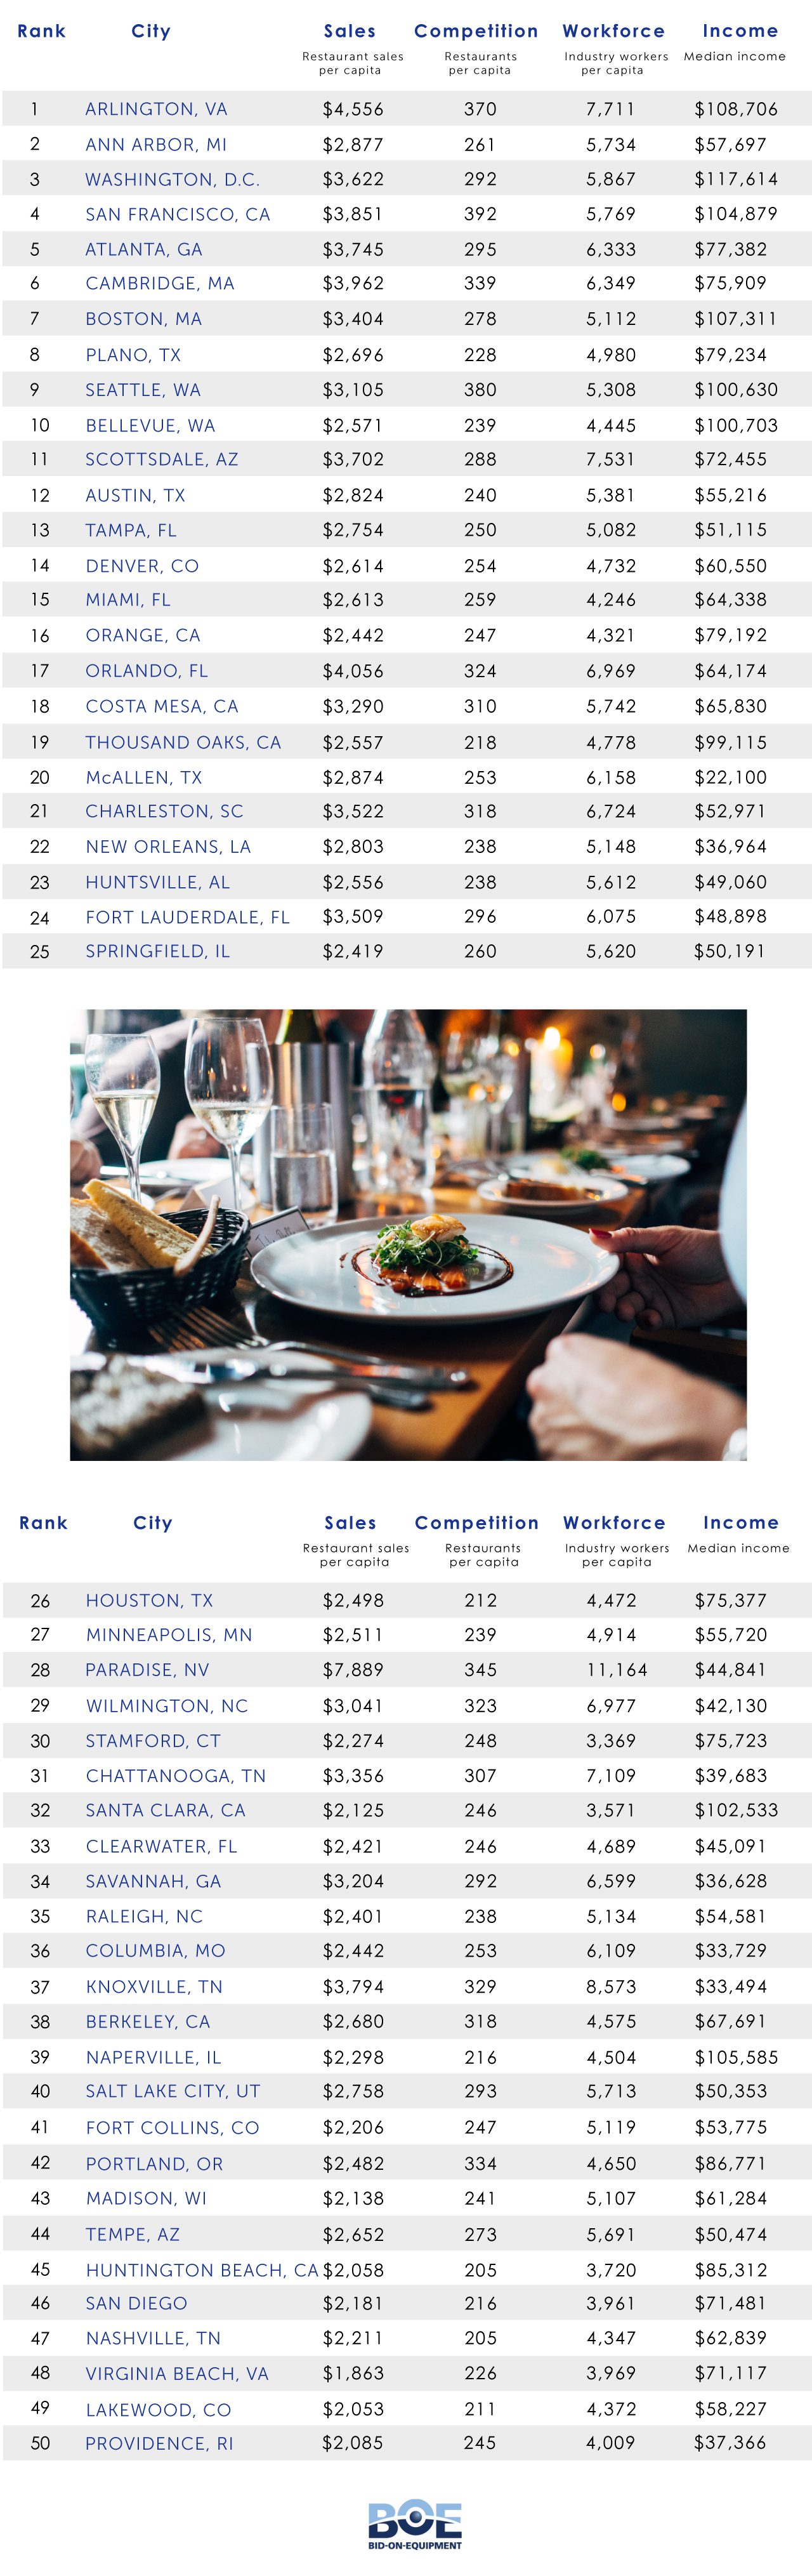
Best Cities to Start a Restaurant
The team at Bid on Equipment surveyed to find the best cities to start a restaurant. There are certainly plenty of factors to think about when it comes to opening a restaurant. Buying restaurant equipment, hiring staff, obtaining permits and marketing are only a handful of “to-dos” that aspiring restaurateurs must keep in mind before opening their doors to the public.
And perhaps the biggest factor of all is location, location, location.
So, what’s the best market to open up a restaurant? After ranking the best cities to start a restaurant, we were able to find out where restaurateurs can get the best return on their investment. To narrow down the list to the top 50, they analyzed four key factors across 236 cities including:
- Annual restaurant sales per capita
- Restaurants per capita
- Number of restaurant industry workers per capita
- Median income in each city
To learn more, read the infographic and click here.
Good News for Restaurants
Encouraging news keeps coming for restaurant operators. Same-store sales growth was 2.0 percent during January as the industry posted its eighth consecutive month of positive growth. January matched December’s growth; the best two months for the industry in more than three years based on same-store sales growth. These insights come from TDn2K’s Black Box Intelligence™ data, based on weekly sales from over 31,000 locations representing 170+ brands and nearly $72 billion in annual sales.
“Winter months are tricky to report on due to the noise in the data coming from weather and the potential effect of holiday shifts,” said Victor Fernandez, vice president of insights and knowledge for TDn2K. “However, it is hard not to remain optimistic about the relative strength of restaurant performance, especially when looking at sales growth over a longer time period. January’s same-store sales growth compared with January 2017 was 1.3 percent. Industry two-year sales growth has now been positive for the past four months, after more than two years of declining growth.”
New Store Openings Continue To Hurt Same-Store Traffic
The bleak headlines continue when it comes to same-store guest counts in chain restaurants. January’s same-store traffic growth was -0.7. Despite remaining negative, traffic growth shows some signs of improvement. The average same-store traffic growth over the last two months was -0.8 percent. By comparison, the average for the previous six months was -1.5 percent. A recent study by TDn2K released to its members at the Global Best Practices Conference in January, analyzed the Black Box Intelligence traffic for existing chain restaurant locations from 2013 to 2018. The study revealed that the average restaurant location lost almost one of every ten restaurant visits in the last five years. The picture is quite different when factoring in the traffic of these newly opened restaurants. Total traffic growth for chain restaurants was actually positive in the last five years. In other words, consumers are not moving away from chain restaurants; in fact the opposite is true. The stark reality is that the net growth in new restaurants opened during the period outpaced population growth. Restaurant visits are diluted over a larger base, which translates into same-store traffic falling on average. Additional studies by TDn2K revealed that despite the industry’s same-store traffic woes, best in class performing restaurant brands are driving positive traffic consistently.
Consumer Spending Expected To Continue Expanding at Moderate Pace
“In the span of just two months, we went from stock market meltdowns to government shutdowns,” commented Joel Naroff, president of Naroff Economic Advisors and TDn2K economist. “Yet despite all the chaos, the economy keeps moving forward. Job growth remains solid and while consumer confidence was hit hard by the Washington political games, the decline is not expected to slow household spending significantly. Ultimately, people determine their consumption levels based on their incomes. Given that the rise in wages should accelerate as the labor markets tighten further, spending on discretionary items, including restaurants, should hold up quite well.” “The only major issue overhanging the economy is the potential for a full-fledged trade war. More than likely an agreement that is more puff than pastry will be the outcome. Once that hurdle is cleared, the economy and consumer spending should expand at a moderate pace the remainder of the year.”
Sales Were Strong Throughout Entire Industry In January
Sales performance was strong across the entire industry for the last two months. All industry segments posted positive same-store sales growth in December and January, the only time this has occurred in the last three years. The best performing segment based on same-store sales during January was fine dining, undoubtedly assisted by a shift in the New Year’s Eve holiday, which fell into the first week of the year in 2019. Conversely, this segment was among the worst performers in December, as the effect of this holiday shift worked against them. Other top performing segments during January were quick service and family dining.
Weather A Factor in January
Severe winter storms were a factor in four out of the five regions of the country with the lowest same-store sales during January, ranging in sales growth from 0.1 to -0.5 percent. New England, New York-New Jersey, the Midwest and Mid-Atlantic all reported same-store sales growth worse than -5.0 percent during the third week of the month, as winter storms kept some consumers from dining out.
Staffing Challenges Continue for Restaurants
According to TDn2K analysis based on data from White Box Social Intelligence™, service is the key attribute of the restaurant experience where top performing brands in the marketplace continue to excel. However, the staffing crisis being experienced in the restaurant industry is making it close to impossible for brands other than those at the highest level of performance to deliver on the service levels they aim to provide. There are many factors contributing to these increased staffing headaches. The industry continues to expand, placing a lot of pressure on those people responsible for keeping restaurants fully staffed. Year-over-year growth in restaurant jobs was 2.4 percent in December according to TDn2K’s People Report™. The sentiment in the industry also points towards rising staffing difficulties. According to the Q4 People Report Workforce Index, 59 percent of participating brands reported that recruiting managers during that quarter was more difficult than during the third quarter. 68 percent of brands reported increased recruiting difficulty for restaurant hourly employees. Poor employee retention continues to be the other roadblock for restaurant service. People Report analysis shows turnover for both hourly employees and restaurant managers increased again in December. Turnover rates remain at historically high levels, which translates to large portions of the industry’s employee base being short-tenured, not fully trained and unengaged in their jobs. For chain restaurants trying to win the share of stomach battle, this situation is not ideal. Poor retention makes it more challenging for operators to provide guests a superior experience that keeps them coming back. TDn2K™ (Transforming Data into Knowledge) is the parent company of People Report™, Black Box Intelligence™ and White Box Social Intelligence™. People Report provides service-sector human capital and workforce analytics for its members monthly. Black Box Intelligence provides weekly financial and market level data for the restaurant industry. White Box Social Intelligence delivers consumer insights and reveals online brand health. TDn2K membership represents 43,000 restaurant units, nearly 2.6 million employees and $72 billion in sales. They are also the producers of leading restaurant industry events including the Global Best Practices Conference held annually each January in Dallas, Texas.
Loyalty Engages Customers, Engenders Trust, Guarantees Brand Profitability
Brand Keys research finds that consumer expectations increase annually on average 25 percent. “Trust has become the connective tissue between brands and loyalty,” said Robert Passikoff, president of Brand Keys. “Expectations for trust are up across all product/service categories and brands an average of 250+ percentyear over year. Meanwhile, customer concerns regarding privacy, security, and brand transparency have reached a tipping point.”
Top brands customers rated highly at creating emotional engagement and loyalty in the restaurant categories are:
Fast Food
1. Chick-fil-A
2. Whataburger
3. In-N-Out
4. McDonald’s
5. Hardee’s
6. Subway
7. Burger King
Fast Casual
1. Panera
2. 5 Guys Burgers & Fries
3. Au Bon Pain
4. Shake Shack
5. Arvy’s
Pizza
1. Domino’s
2. Pizza Hut
3. Papa Murphy’s
4. Little Caesars
5. Papa John’s
6. Chuck E. Cheese
Out-of-Home Coffee
1. Dunkin’
2. Starbucks
3. McDonald’s
4. Tim Hortons
Top 10 Brands That Know The Secret of Loyalty
“Brands looking for guaranteed profits, can’t do better than loyal customers,” noted Passikoff. This year’s 2019 CLEI identified 10 brands regularly #1 in their categories, some from the time the category was established. “The following brands are perennial stars.”
Discover Card – Credit Cards: 23 years
Avis – Car Rental: 20 years
Google – Search Engine: 19 years
Domino's – Pizza: 15 years
Dunkin' – Out-of-Home Coffee: 13 years
Konica Minolta – MFP Office Copiers: 12 years
Hyundai – Automobiles: 10 years
AT&T Wireless – Wireless: 10 years
Amazon.com – Online Retailer: 10 years
Amazon Kindle – E-Reader: 9 years
“Today, loyalty is a fusion of emotional engagement, trust, and an ability for a brand to engage; to meet or exceed expectations consumers hold for their Ideal product or service. The brands on top of this year’s category lists know that,” said Passikoff. “More importantly they know how.”
Loyalty’s Fiscal Bottom Lines
“Marketers relying on a definition of ‘loyalty’ and ‘engagement’ as something they’ll recognize when it impacts their brands will be disappointed,” said Passikoff. “Brand awareness is not loyalty; satisfaction is not loyalty; entertainment is not loyalty.”
In 2019, and for the foreseeable future, there are three concrete fiscal realities of loyalty and engagement that marketers should keep in mind:
- It costs 9 to 11 times more to recruit a new customer than to keep an existing one.
- An increase in loyalty of only 7 percentcan lift lifetime profits per customer by as much as 85 percent.
- Depending upon the sector, an increase in loyalty of just 3 percentis equivalent to a 10 percentacross-the-board cost reduction program.
A complete list of the 2019 CLEI’s loyalty and engagement winners can be found here.
“Decision-making has become increasingly emotionally-driven over the past decade,” said Passikoff. “But the addition of increased expectations for brand trust has radically altered the category landscape. Neither ‘business as usual’ nor ‘more social networking’ will cut it in this new brandscape. Brands have to move loyalty to the top of their to-do lists.”
Healthy Eating and Bagel Lovers
Starting with January, ezCater tracked healthy eating habits tied to New Year’s Resolutions and revealed that salad orders grew by 10 percent nationally through the year's first three weeks, while pizza orders nosedived by 20 percent, compared to the same period in December.
As the network that connects millions of lunch-hungry office dwellers with over 60,000 restaurants and other caterers annually, ezCater also produced some notable city-specific data:
- Indianapolis is 2019's healthy eating star thus far (salad orders up 36 percent, pizza orders down 56 percent)
- Silicon Valley (salad up 23 percent, pizza down 6 percent) and Seattle (salad up 26 percent, pizza down 27 percent) are in a tech HQ good eating grudge match
- Los Angeles is keeping up its spa cuisine image (salad up 12 percent, pizza down 37 percent)
- Boston can add better food bragging rights to its beloved Sox and Pats boasts (salad up 15 percent, pizza down 30 percent)
- Chicago has moved well past its brats 'n beers rep…at least come lunchtime (salad up 6 percent, pizza down 31 percent)
The company also set out to find the top bagel loving cities across the nation as well as how bagel orders compared nationally throughout 2018.
No surprise, New Yorkers love their bagels with NYC making up nearly 40 percentof all bagel orders on ezCater, followed by Boston and Washington, DC.
Top 10 Bagel-Loving Cities
1. New York, NY
2. Boston, MA
3. Washington, DC
4. San Jose, CA
5. Atlanta, GA
6. San Francisco, CA
7. Chicago, IL
8. Philadelphia, PA
9. Los Angeles, CA
10. Phoenix, AZ
The South saves their carbs for other meals – Houston, Austin, Nashville and Raleigh are among the cities that ordered the least number of bagels last year. The network that connects millions of hungry office dwellers with over 60,000 restaurants and other caterers annually also revealed the following month-to-month data:
- Carbing-up for the winter, September through November racked-up the highest bagel orders while the lowest bagel orders occurred in January and February, presumably as people start their low-carb healthy eating resolutions.
The Impact of Missing a Shift
A study reveals that for today’s hourly workforce, missing a single shift comes at a steep cost. The new research from WorkJam — a leading digital workplace platform — found that for nearly half of employees surveyed, one missed shift means late payments on rent, utilities, and other basic necessities.
“Today’s workforce is living paycheck to paycheck,” says Steven Kramer, co-founder, president, and CEO of WorkJam. “For them, the loss of a single shift can jeopardize control over their entire livelihood.”
Titled “The Economic Impact of Missing a Single Shift,” the study is based on data collected from over 1,000 U.S.-based hourly employees and employers across the retail, hospitality, logistics, healthcare, and banking industries. It exposes the far-reaching implications of missing a single shift, including being unable to pay utilities on-time (49 percent of respondents), missing rent (27 percent of respondents), and foregoing groceries for a week (25 percent of respondents).
According to Kramer, these findings should call attention to the impact miscommunication and erratic scheduling practices has on frontline workers.
“It’s never been more important for employers to make communication and scheduling a priority, so that they aren’t putting their employees at risk of foregoing basic necessities,” he said.
But improving scheduling is a tall order for industries still reliant on outdated methods. As the study revealed, 55 percent of hospitality and 57 percent of retail workers still depend on paper schedules posted in break rooms to determine their weekly shift assignments.
“Miscommunication and scheduling inconsistencies deepen the disconnect between employers and their frontline employees,” Kramer said. “This drives down employee engagement, which can have a major impact on a company’s bottom-line.”
A consistent work schedule can empower hourly employees to control their economic well-being. By simplifying the front-end distribution and management of schedules and unexpected shift changes, digital workplace platforms such as WorkJam help managers improve staffing while aligning work shifts to the needs of their employees.
“It’s never been more important for employers to consider investing in a digital workplace platform,” Kramer said.
To download the report, click here.
RBI Performance Expectations
Restaurant Brands International is headed for success in 2019, says GlobalData
Following Restaurant Brands International’s full year and Q4 2018 results, Lewis Towell, Consumer Analyst at GlobalData, offers his view:
“2018 was a year which saw the company playing catch up with competitors, implementing all day breakfasts in Tim Hortons, rolling out delivery, and trying to expand all of its brands more aggressively using its franchising model, with Popeyes seeking expansion in areas such as the Philippines.
“The full year results suggest that the company is starting to see the benefits of these decisions. However, Tim Hortons' results continue to cause pause for thought, especially in the US. With the fast food and coffee market in the US so rich in world famous brands that are facing a lot of small, innovative brands, it takes more for larger brands to do well there. Until they deliver something unique, it is going to be difficult to turn consumers' heads. Nevertheless, Tim Hortons and Restaurant Brands International as a whole are headed in the right direction.
“The company has done well to cater to local tastes when introducing Tim Hortons abroad while maintaining products which are synonymous with the brand, such as offering tostadas for breakfast in Spain alongside its regular menu. It has also successfully began shifting its franchises toward the new normal in fast food, with kiosks, delivery and loyalty schemes all seeming to help keep sales headed in the right direction. All of this indicates that the company is headed in the direction and should continue to reap the benefits of the changes it has implemented in the first half of 2019.”
Holiday Retail Sales Fell
Holiday retail sales during 2018 grew a lower-than-expected 2.9 percent over the same period in 2017 to $707.5 billion, the National Retail Federation said today after the Commerce Department released data that had been delayed by nearly a month because of the recent government shutdown.
“All signs during the holidays seemed to show that consumers remained confident about the economy,” NRF President and CEO Matthew Shay said. “However, it appears that worries over the trade war and turmoil in the stock markets impacted consumer behavior more than we expected. There’s also a question of whether the government shutdown and resulting delay in collecting data might have made the results less reliable. It’s very disappointing that clearly avoidable actions by the government influenced consumer confidence and unnecessarily depressed December retail sales.”
The numbers, which exclude automobile dealers, gasoline stations and restaurants, fell short of NRF’s forecast last fall that holiday sales from November 1 through December 31 would grow between 4.3 percent and 4.8 percent to between $717.45 billion and $720.89 billion.
The total includes $146.8 billion in online and other non-store sales, which grew 11.5 percent over 2017. NRF had forecast that the online sector of retail would grow between 11 percent and 15 percent to between $151.6 billion and $157 billion.
November – the first half of the holiday season – grew 5.1 percent unadjusted year-over-year. But December was up only 0.9 percent year-over-year and down 1.5 percent seasonally adjusted from November. NRF does not count October as part of the holiday season, but much holiday shopping has shifted earlier, and October was up 5.7 percent year-over-year. As of December, the three-month moving average was up 0.7 percent over the same period a year ago.
“Today’s numbers are truly a surprise and in contradiction to the consumer spending trends we were seeing, especially after such strong October and November spending,” NRF Chief Economist Jack Kleinhenz said. “The combination of financial market volatility, the government shutdown and trade tensions created a trifecta of anxiety and uncertainty impacting spending and might also have misaligned the seasonal adjustment factors used in reporting data. This is an incomplete story and we will be in a better position to judge the reliability of the results when the government revises its 2018 data in the coming months.”
NRF’s numbers are based on data from the U.S. Census Bureau, which said today that overall December sales – including auto dealers, gas stations and restaurants – were down 1.2 percent seasonally adjusted from November but up 2.3 percent unadjusted year-over-year.
The holiday numbers come as NRF is forecasting that retail sales during 2019 will increase between 3.8 percent and 4.4 percent to more than $3.8 trillion.
Year-over-year results from key retail sectors during the November-December holiday season include:
Online and other non-store sales were up 11.5 percent at $146.8 billion.
Clothing and clothing accessory stores were up 4.2 percent at $61.7 billion.
Health and personal care stores were up 2.6 percent at $60.8 billion.
General merchandise stores were up 2.3 percent at $146.8 billion.
Grocery and beverage stores were up 1.9 percent at $130.5 billion.
Building materials and garden supply stores were up 1.6 percent at $61.5 billion.
Electronics and appliance stores were up 0.2 percent at $22.3 billion.
Furniture and home furnishings stores were unchanged at $22.6 billion.
Sporting goods stores were down 13.5 percent at $16 billion.
Travelers Eat Breakfast
A new survey from the Hyatt Place brand found that the more people spend their time away from home, the more likely it is that they will eat the proverbial “most important meal of the day.”
The survey of 1,507 respondents, which was conducted by Toluna on behalf of the Hyatt Place brand, looked at a range of breakfast habits among those who travel at least six times or more per year (frequent travelers) versus those who travel five times per year or less (infrequent travelers). The findings are as follows:
- A majority 63 percent of respondents who identify themselves as frequent travelers indicate they eat breakfast at least three or more days per week
- 45 percent of infrequent travelers indicate the same
- Nearly half (49 percent) of frequent travelers indicate they eat breakfast more often while traveling, while 40 percent of infrequent travelers indicate the same
- For those who indicated why they eat breakfast more often while traveling, frequent travelers were most likely to credit extra time as a key factor for “why,” while infrequent travelers were most likely to credit someone else making it for them as their main reason “why”
- Eating breakfast tops the list of things frequent travelers would do with an extra 30 minutes in the morning, while infrequent travelers were more likely to choose sleep
- A majority (53 percent) of all Americans, and nearly two-thirds of frequent travelers (63 percent) have chosen a hotel because of its breakfast offering
- Nearly half (49 percent) of frequent travelers describe breakfast as being made up of their favorite foods, compared to 36 percent of infrequent travelers
- One in three frequent travelers have met someone new while eating breakfast at a hotel
- Eggs/omelets are the go-to breakfast choice for Americans overall (26 percent), followed by breakfast sandwiches (15 percent) and then pancakes (eight percent)
Customer Service Frustrations
When asked to rank their top three frustrations with telephone customer service, the largest percentage of people chose being kept on hold (57 percent), followed by rude service (52 percent), and automated phone menus (51 percent).The data comes from a new survey report that explores why businesses must prioritize speed when managing their phone lines, and how they can implement improvements. Clutch conducted the survey of 501 people who called a business more than three times in the past six months.
Businesses should think both analytically and creatively about how they can reduce phone hold times. To approach the issue analytically, businesses should collect data on their hold times, asking questions such as:
- When are customers on hold the most?
- What departments receive the most calls?
- What questions do customers most commonly ask?
Some creative options for reducing hold times include calling the customer back when they are at the front of the line instead of making them wait on the phone, or offering them an option to schedule a call back for a more convenient time.
Customers Prioritize Efficiency When Calling Businesses
People most often ranked an “efficient resolution to my issue” (79 percent) as the trait they value most when calling business.
To increase efficiency, businesses can consider balancing their telephone customer service with other AI-based solutions, such as chatbots.
Shep Hyken, a customer service and experience expert, speaker, and author, said that chatbots work well for questions such as “Where’s my package?” or “I want to check my bank balance.”
“You don’t need to talk to a human to answer those questions and often, it’s more efficient to do so with a digital format,” Hyken said.
Businesses Shouldn’t Abandon Their Phone Lines
Given all the new communication options available, some businesses may be tempted to give up on their phones, directing all customers to chatbots, social media, or contact forms.
Yet, phones remain a critical customer communication channel for complex or personalized inquiries. In the past six months, people most commonly called a business to fix an issue (24 percent), ask a question (23 percent), or make an appointment (19 percent).
“How many times will you contact a business and they’ll send you a link to their FAQ page, and you say, ‘I already checked that page, or otherwise, I wouldn’t be messaging you,’” said Nathan Strum, CEO of Abby Connect, a virtual receptionist and telephone answering service provider. “It’s frustrating when people don’t think [their issue] falls into a certain category, even if in the end, it might. They want to feel heard.”
Read the full report here.
Using AI for Consumer Insights
Consumer brands have long used old-fashioned focus groups, interviews and surveys to best gauge consumer wants, desires and needs as part of processes that range from product development, to marketing and sales. As machine learning and artificial intelligence (AI) have emerged, there is an increasing interest in the ability to harness these solutions to save time and money, and to yield more reliable consumer insights.
Machine learning can help to analyze user-generated content (UGC), which involves the collection of data from online reviews, social media, and blogs, that provide insights on consumer needs, preferences and attitudes.
Despite the potential for better information, marketers have raised concerns over the value of UGC data because the sheer scale and quality of UGC makes it difficult to process. While the data is accessible, identifying consumer insights requires human beings to analyze the data, which is hard to do at scale.
Two researchers from the Massachusetts Institute of Technology (MIT) decided to tackle this problem through research designed to examine the challenge of how to most efficiently use UGC to identify customer needs in ways that are more cost-efficient and accurate.
The study to be published in the February edition of the INFORMS journal Marketing Science is titled “Identifying Customer Needs from User-Generated Content,” and is authored by researchers from MIT.
They find that machine learning can improve the process for identifying customer needs, while reducing research time substantially, helping consumer marketing brands avoid delays in bringing products to market.
“As more and more people turn to the digital marketplace to research products, share their opinions, and exchange product experiences, large amounts of UGC data is available quickly and at a low incremental cost to companies,” the authors said. “In many brand categories, UGC is extensive.
For example, there are more than 300,000 reviews on health and personal care products on Amazon alone. If UGC can be mined for customer needs, it has the potential to identify customer needs better than direct customer interviews.”
Other advantages of UGC data are that it is updated continuously, which enables companies to stay current with their understandings of customer needs. And unlike customer interviews, UGC data is available for research to return to further explore new insights.
To conduct their research, the study authors constructed and analyzed a custom data set which compares the customer needs for the oral-care category identified from direct interviews to the customer needs from Amazon reviews. The data set was constructed in a partnership with a marketing consulting firm to ensure the industry-standard quality of the interviews and insights.
The authors developed and evaluated a machine-learning hybrid approach to identify customer needs from UGC. First, they use machine learning to identify relevant content and remove redundancies. The processed data is then analyzed by human beings to formulate customer needs from selected content.
“In the end, we found that UGC does at least as well as traditional methods based on a representative set of customers,” the authors said. “We were able to process large amounts of data and narrow it to manageable samples for manual review. The manual review remains an important final part of the process, since professional analysts are best able to judge the context-dependent nature of customer needs.”