
MRM Research Roundup: Mid-February 2020-Valentine’s Day Edition
16 Min Read By MRM Staff
Welcome to the "Love" edition of Modern Restaurant Management (MRM) magazine's Research Roundup, which offers Valentine and dating trends, the State of Local Restaurants and the Brand Bowl Report.
Unique Valentine's Day Trends
Postmates found that chocolates, flowers & food are all as popular as ever on Valentine’s day, as you’d expect, but this year they took a look at the romantic orders for February 14 that are a little less expected.
Top trending things that aren’t flowers or chocolates
- Orders from specialty stores increase by a whopping 329 percent including orders for balloons from party stores and gifts from the likes of Kiehl's and Le Labo. Among these specialty store orders, requests for adult shop items jump up to 52 percent in the categories of massage & body, toys/vibrators, sexy games, sexy clothes/wearables and sexy Kits
- Another big non-food or flower delivery? Clothing! Clothing orders on Postmates for Valentine’s Day increase by 200 percent including one order for a 'Onesie – Heart U' from MeUndies – how cute! 🙂
- We’ve also seen a 57 percent increase in alcohol orders with the most deliveries made for red wine, hard alcohol (vodka and Hennessey) and Champagne.
- And to round out the most romantic day of the year, there is an 88 percent increase in ice cream orders. The top ice cream flavor ordered on Valentine’s Day? Chocolate Chip Cookie Dough. The least favorite? Butter Pecan. But whatever your flavor of choice, Postmates is celebrating by offering a FREE pint of Ben & Jerry’s ice cream from 7-Eleven with the code happyvday (code valid through 2/10-2/16).
Most ordered Valentine’s Day Items that aren’t food or flowers
- Alcohol – 57 percent increase in orders
- Red Wine
- Hard alcohol (vodka and Hennesy)
- Champagne
- Specialty Stores -329 percent increase in orders
- Balloons
- Candles
- Adult shop items (massage & body, toys/vibrators, sexy games, sexy clothes/wearables and sexy Kits)
- Clothing – 200 percent increase in orders
- Most unique order being a 'Onesie – Heart U' from MeUndies
State of Local Restaurants
Womply unveiled its third annual State of Local Restaurants report – a comprehensive look at when local restaurants do the most business, seat the most guests, and more.
The report reveals a wide range of consumer spending trends at local restaurants, including how sales vary during the days of the week, months of the year, and on major holidays.
Powered by analysis of transaction data from more than 36,000 restaurants in every corner of America during every day of the 2019 calendar year, the report includes analyses for restaurants at the national and state levels, as well as city-level reports for the first time for 50 of the country’s largest markets, including:
“When you run a local restaurant, it’s a significant advantage to know where you stand against your peers,” says Womply Founder Toby Scammell. “With the 2020 edition of our State of Local Restaurants report, restaurant owners and operators have unprecedented visibility into sales trends and patterns at restaurants in their region.”
Among the major findings, the report shows Mother’s Day weekend is still prime time for local restaurants. The Saturday and Sunday of Mother’s Day weekend are the No. 1 and No. 2 revenue days of the year, respectively. Both days are more lucrative than prominent days like Valentine’s Day, Super Bowl Sunday, New Year’s Eve, Cinco de Mayo, and St. Patrick’s Day.
The report uncovered consistent sales patterns for local restaurants, with moderate seasonality. As a share of total yearly revenue, local restaurants see the highest weekly sales totals from April 1 through September 1. Weekly, sales spike on the weekend, as expected. In general, the average weekend is bigger than most prominent holidays.
Nationally, on a typical day, local restaurants see 47 transactions at $28 per ticket for an average daily revenue of over $1,350. On a state level:
- Local restaurants earn the most in Vermont ($1,916/day), Rhode Island ($1,743/day), North Carolina ($1,666/day), California ($1,652/day), and Alaska ($1,625/day).
- Local eateries earn the least in West Virginia ($935/day), Wisconsin ($908/day), Oklahoma ($892/day), Ohio ($884/day), and Mississippi ($726/day).
- North Carolina was home to the busiest local restaurants, with an average of 66 transactions on a given day.
- Rhode Island is where patrons spend the most eating out, with an average ticket of $37.20 per restaurant.
The report also revealed some notable revenue trends with regard to seasonality and holiday sales:
- Valentine’s Day is a surprisingly modest day for most restaurants, ranking No. 94 out of all 365 days in terms of revenue.
- Super Bowl Sunday is in the bottom half of revenue days for the year at No. 228.
- Cinco de Mayo and St. Patrick’s Day are the No. 93 and No. 117 days respectively.
- Patrons spend more at local restaurants when the weather warms up. May, June, July, and August each account for at least 9 percent of total yearly spending.
- January and February are the two slowest months of the year, bringing in 6.8 percent and 7.1 percent of total yearly consumer spend, respectively.
Womply’s 2020 State of Local Restaurants report is now available on Womply.com.
Foot Traffic Analysis
Popeyes continued to benefit from the initial spike of the Chicken Wars, according to foot traffic analytics platform Placer.ai. Following the dramatic jump in early November when the Chicken Sandwich was relaunched, visits began to return back to normal levels. Yet, instead of falling all the way back to the rates pre-summer 2019, the excitement persisted.
According to the newly released report, on Friday, January 17, visits rose 59.3 percent above the baseline for the period between January 1, 2017 and January 20, 2020. Analyzing that same period, every week in January has come in at least 20 percent or more above the baseline for weekly traffic.
Where Popeyes trailed its poultry rival throughout 2017, 2018 and most of 2019, the new product put the brand on nearly equal footing with KFC. Popeyes’ traffic even surpassed KFC’s nationwide in December and early January.
The Brand Bowl Report
goPuff released its third annual Brand Bowl Report, detailing how consumers reacted to some of our favorite brands’ commercials and what fans ordered most during the big game.
Commercials At Work
goPuff tracked nationwide customer orders for products advertised during the Big Game. Here’s how those ads impacted immediate sales in the minutes after the commercials aired. Percent changes based on orders one-hour before compared to orders in the hour after the commercial aired.
Brand Bowl Winners
Pop-Tarts: This brand had an impressive 47 percent increase in orders in the hour following the brand’s commercial.
Mountain Dew: Mountain Dew orders increased 17 percent in the hour after the brand’s ad aired.
Pringles: Back in 2019, Pringles orders increased 23 percent after the ad aired. This year, the company’s ad was even more effective, driving a 60 percent increase in orders for Pringles products on goPuff immediately following the ad.
Secret Deodorant: Though not a traditional Big Game snack or party item, orders for Secret Deodorant increased 300 percent after the ad aired.
Planters: Orders for Planters’ products increased 42 percent in the hour during which the brands’ ad aired. Also of note: after Mr. Peanut’s ‘death’ on Jan. 22, 2020, Planters’ orders hit a one-year high on goPuff.
Cheetos: Orders increased 23 percent for Cheetos products following the commercial.
Snickers: Snickers orders increased 18 percent following the airing of its Big Game commercial.
Tide: With ads airing throughout the night, there was a 75 percent uptick in Tide orders at 7:00 p.m. just after the first Tide commercial aired. After that, orders for Tide products remained steady through the end of the game.
Brand Bowl Losers
Doritos and Pepsi: Orders for these game time favorites peaked early, but despite the brands’ ads, orders decreased slightly every hour after 8:00 p.m. as gatherings wound down. Doritos orders decreased 24 percent after its ad aired, Pepsi orders decreased 2 percent after its commercial and Coke orders decreased 15 percent.
Bud Light, Bud Light Seltzer and Michelob: As a category, goPuff saw orders for alcohol products peak earlier in the day – around noon Eastern – as customers geared up for their viewing parties later that night. Orders for most alcohol brands were high during the first hour of the game, but ads throughout the game did not seem to immediately impact orders on goPuff.
What Fans Ordered
Historically, Americans eat – a lot – during the Big Game. Customers’ favorite game day munchies included:
Snacks: Gushers Flavor Mixer, Tostitos Salsa con Queso (Medium), Flamin’ Hot Cheetos*, Haribo Gummi Bears, Tostitos Chunky Salsa (Medium)
Alcohol: White Claw Seltzer, Natural Light, Corona Extra, Bud Light Lime, Bud Light Seltzer*
Drinks: Gatorade, Sprite, Pepsi*, Coca-Cola*, Mountain Dew*
Beyond food and drinks, though, customer orders show fans were in need of party and clean-up supplies along with some medicine to make their Monday morning a bit smoother:
Home Essentials: Red Party Cups, Charmin Toilet Paper, Scott Toilet Paper, Repurpose Compostables Plates, Puffs Ultra Soft & Strong Tissues
OTC Medicine: Morning Recovery Hangover Drink, Tums Antacid Extra Strength Fruit Chewable Tablets
goPuff stocks more than 2,500 products in centrally located facilities in each of the 150+ locations that it serves to bring products directly to the customer in the moments they need them most. From household essentials like cleaning products, diapers and even pet goods to game time essentials, including ice cream, candy and beverages, the unique delivery concept answers the call for customers 24/7 in many markets (and until 4:30 a.m. in others).
Super Search Stats
And more Super Bowl post-show search stats from retail analytics firm Stackline. '
Reese’s. Reese’s first ever Super Bowl commercial was all about their Take 5 candy bar. The humorous commercial of a woman in her cubicle resulted in total traffic for Reese’s Take 5 products to surge 785 percent on Amazon last week vs. the prior week. Retail sales also increased 441 percent during this period, with the Pack of 18 Take 5 bars winning the top retail sales spot.
Mountain Dew. Mountain Dew’s Super Bowl commercial “Zero Sugar, As Good as the Original” featured their new MTN DEW Zero Sugar in a remake of a scene from ‘The Shining.’ Total traffic for MTN DEW Zero Sugar products increased 322 percent last week vs. the prior week and retail sales increased 17 percent. Top product was the 18 pack of MTN DEW Zero Sugar 12oz.
Cheetos. Cheetos Popcorn was introduced during their Super Bowl commercial featuring MC Hammer and his song “Can’t Touch This.” As a result, total traffic for Cheetos Popcorn products increased 258 percent last week vs. the prior week, with retail sales increasing 238 percent. The Cheetos Popcorn 40 Pack variant featuring both Cheddar and Flamin’ Hot flavors was the best seller.
Pepsi. Similar to Mountain Dew, Pepsi’s Super Bowl commercial advertised their Zero Sugar offering and featured Missy Elliott and H.E.R. with the tagline “Zero Sugar. Done Right.” Total traffic for Pepsi Zero Sugar increased 249 percent last week vs. the prior week, and retail sales increased 67 percent.The Pepsi Zero Sugar 12 Pack of 12oz cans was the top selling variant, although the 6 Count Zero Sugar bottles increased at a faster rate.
Coca-Cola. Coca-Cola’s new Coke Energy (“Energy you want. Taste you love.”) was released at the beginning of the month and featured in their Super Bowl commercial with filmmaker Martin Scorsese and actor Jonah Hill. For Coke Energy products, total traffic increased 246 percent on Amazon last week vs. the prior week, and retail sales increased 221 percent. Top sellers included the 12oz 24 Pack, Regular and Sugar Free.
Food Waste is Higher
Consumers are likely wasting much more food than commonly believed, according to a study published February 12 in the open-access journal PLOS ONE by Monika van den Bos Verma and colleagues from Wageningen University and Research, The Netherlands.
The Food and Agriculture Organization of the United Nations (FAO) estimated that in 2005, one third of all food available for human consumption was wasted (in this context, “waste” refers to food fit for human consumption which went uneaten). This figure has continued to serve as reference for the extent of global food waste. However, the FAO methodology does not factor in consumer behavior regarding food waste and considers food supply alone in determining the extent of food waste. This study is the first to investigate if and how consumer affluence may affect food waste.
Using a human metabolism model and data from FAO, the World Bank, and the World Health Organization, van den Bos Verma and colleagues quantified the relationship between food waste and consumer affluence. Using this model, they created an international dataset providing estimates of global as well as country specific food waste.
The authors found that once consumer affluence reaches a spending threshold of approximately $6.70/day per capita per day, consumer food waste starts to rise– increasing rapidly with rising affluence at first, and then at much slower rates at higher levels of affluence.
Their data also showed that FAO’s estimates of consumer food waste may be too low. While FAO estimated food waste to be 214 Kcal/day per capita in 2015, this model estimated food waste as 527 Kcal/day per capita for the same year.
This work relies on the accuracy of FAO’s data, which may not always be complete (for instance, low-income country surveys don’t always include food from subsistence farming). The authors also note there are many consumer attributes that may affect food wastage beyond affluence.
However, this work suggests that to achieve low global food waste, a joint focus on 1) reducing high food waste levels in high income countries, and 2) preventing waste levels from rising rapidly in lower-middle income countries where affluence is increasing may be needed. The authors believe that the method behind this study can be used as a basis to introduce the affluence elasticity of waste as a new concept in future models, better understand and assess current food waste magnitudes, and help measure global progress in reducing food waste.
The authors add: “Novel research using energy requirement and consumer affluence data shows that consumers waste more than twice as much food as is commonly believed. It provides a new globally comparable base against which one can measure progress on the international food waste target (SDG12), and suggests a threshold level of consumer affluence around which to launch intervention policies to prevent food waste from becoming a big problem.”
To review the report, click here.
UK Mispronouncing Food Words
UK holiday makers are allowing their fear of mispronouncing words and phrases when abroad limit their experiences? Despite Brits reportedly taking an average of 1.9 holidays outside of the UK in 2019, it seems many UK holiday makers are allowing their fear of mispronouncing words and phrases when abroad limit their experiences, according to new research.
The study from cruise agent, Bolsover Cruise Club, surveyed 1,000 UK adults and found that one in ten UK adults actually refuse to try new food and drink items when abroad due to being unable to pronounce them correctly.
Top 10 Food/Drinks that Brits Actually Struggle to Pronounce
|
Name of Food/Drink |
percent who answered incorrectly |
Correct Pronunciations |
|
Sriracha |
96.7 percent |
See-rotch-ah |
|
Poke |
95.2 percent |
Poh-kay |
|
Gyros |
93.0 percent |
Yee-ros |
|
Viennoiserie |
92.7 percent |
Vyen-wahz-ree |
|
Pho |
85.7 percent |
Fuh |
|
Paczki |
85.7 percent |
Pownch-key |
|
Poutine |
85.4 percent |
Poo-teen |
|
Raclette |
71.9 percent |
Ra-klet |
|
Edamame |
69.6 percent |
Ehd-ah-mah-mee |
|
Caipirinha |
66.7 percent |
Kai-puh-ree-nyuh |
In fact, just a fifth of Brits are willing to branch out and try new things every time they dine out abroad.
Other reasons given for avoiding ordering certain dishes, included following vegan or vegetarian diets (15 percent), admittedly being a fussy eater (15 percent) and being reluctant to try new things (13.3 percent).
Embarrassment, it seems, comes with a rather hefty price tag, as 15 percent of Brits admitted they will actually tip higher when abroad as a way of apologising for the language barrier, meaning an additional £19.5Million paid out per year on average in tips alone.
When tested on their ability to correctly pronounce specific food and drink related terms, when it came to some of the produce we’re likely to regularly come across in the supermarket, there was still plenty of room for error.
Less than half (45.5 percent) of those who believed they could correctly pronounce espresso succeeded in doing so, incorrectly replacing the “s” sound with an “x” (ex-spreh-soh).
Despite being homed within the UK, just 36.6 percent of Brits can identify the correct pronunciation of Worcestershire (sauce).
Although just over 10 percent of Brits stated they were confident in their pronunciation of the polish sweet treat, Paczki, almost 15 percent actually picked out the correct way to do so.
Similarly, more than a fifth shared they would happily rightly identify the pronunciation of Vietnamese dish, Pho, on the other hand, yet less than 15 percent actually were able to when tested
Just 7 percent of those surveyed could spot the correct way to pronounce the Greek delicacy, Gyros, compared to the 30 percent who believed they could do so when initially asked.
Michael Wilson, Managing Director at Bolsover Cruise Club, commented on the findings:
“Whilst language barriers can understandably be a daunting factor for many holidaymakers, they certainly shouldn’t stop us from branching out and trying new things, especially when it comes to food and drink.
“Cruises are a great option for those of us who want the opportunity to try something a little different, in part because there is a plethora of choice when it comes to dining on board, as well as the opportunity to visit a whole host of destinations within a single trip.
“Of course, we would encourage everyone to step outside of their comfort zone when on holiday, to give a new language a try, even if it’s just a handful of phrases, and to fully immerse themselves in the culture – you won’t regret it!”
The Value of Cleanliness
A growing majority of consumers value businesses’ well-kept restrooms so much that they are willing to spend more money when they encounter one, according to new national research. The number of Americans who will “definitely” or “probably” shell out more cash in response to clean restrooms has climbed to 62 percent this year from just 45 percent two years ago. Millennials and Gen Xers are the two generations most likely to open their wallets.
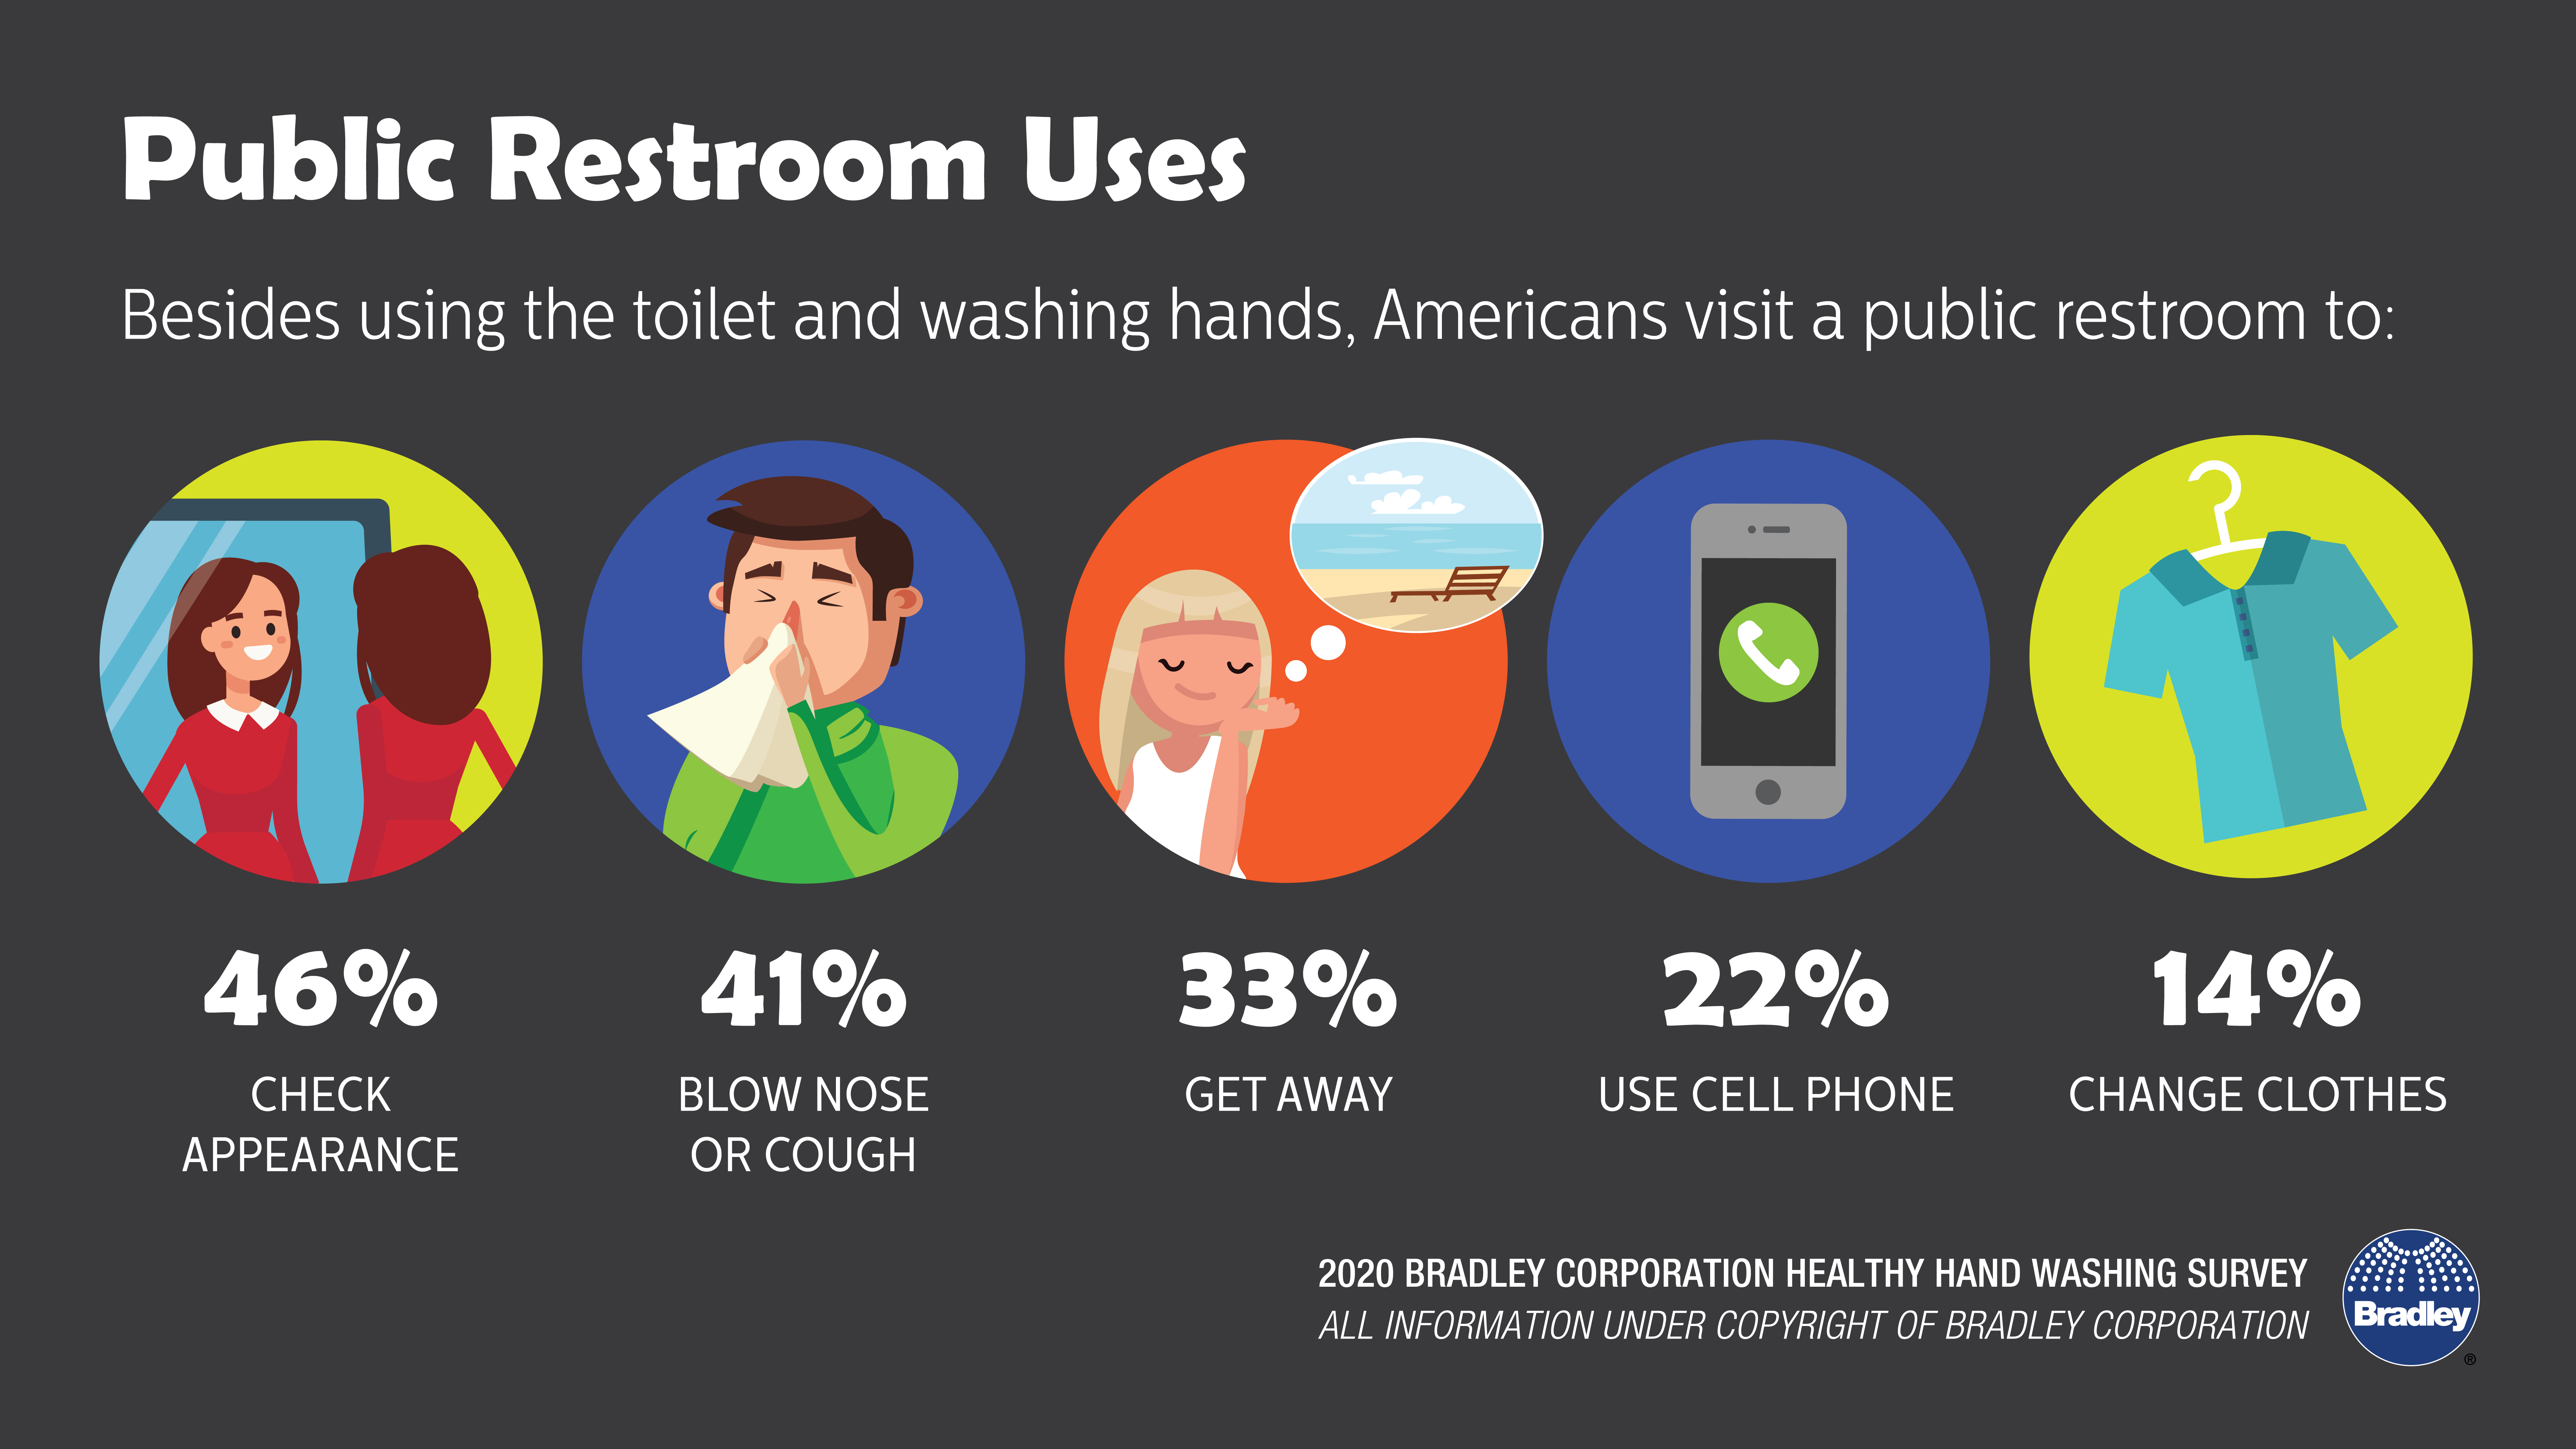
The study also found that almost 3 out of 4 Americans make it a point to visit a business because they know it has nice restrooms. Women are especially likely to show preferential treatment, as are Millennials and Gen Xers.
The findings are part of the 11th annual Healthy Hand Washing Survey conducted by Bradley Corporation that queried 1,005 adults and youth throughout the United States about public restroom preferences and hand washing habits.
Put cleaning on the schedule
“Increasingly, our survey underscores that clean restrooms attract business,” says Jon Dommisse, director of strategy and corporate development for Bradley Corp. “Even posting and maintaining a cleaning schedule in restrooms helps reassure customers the facility is clean. Over half who have observed such a schedule say it makes them feel more positive about the business.”
Even though consumers are keen on rewarding restroom-friendly companies, more Americans are having unpleasant experiences in a public restroom. This year, a record-high 76 percent report having a particularly bad encounter.
“While it’s encouraging that consumers are willing to reward businesses that have nice restrooms, there is a growing disconnect that more Americans are experiencing unpleasant restrooms,” Dommisse said.
Business blowback from bad restrooms
Restrooms that are dirty or in disarray generate negative impressions causing customers to take their business elsewhere, according to the survey. Close to 60 percent of Americans will leave the business immediately or say they are unlikely to return after encountering unpleasant restrooms.
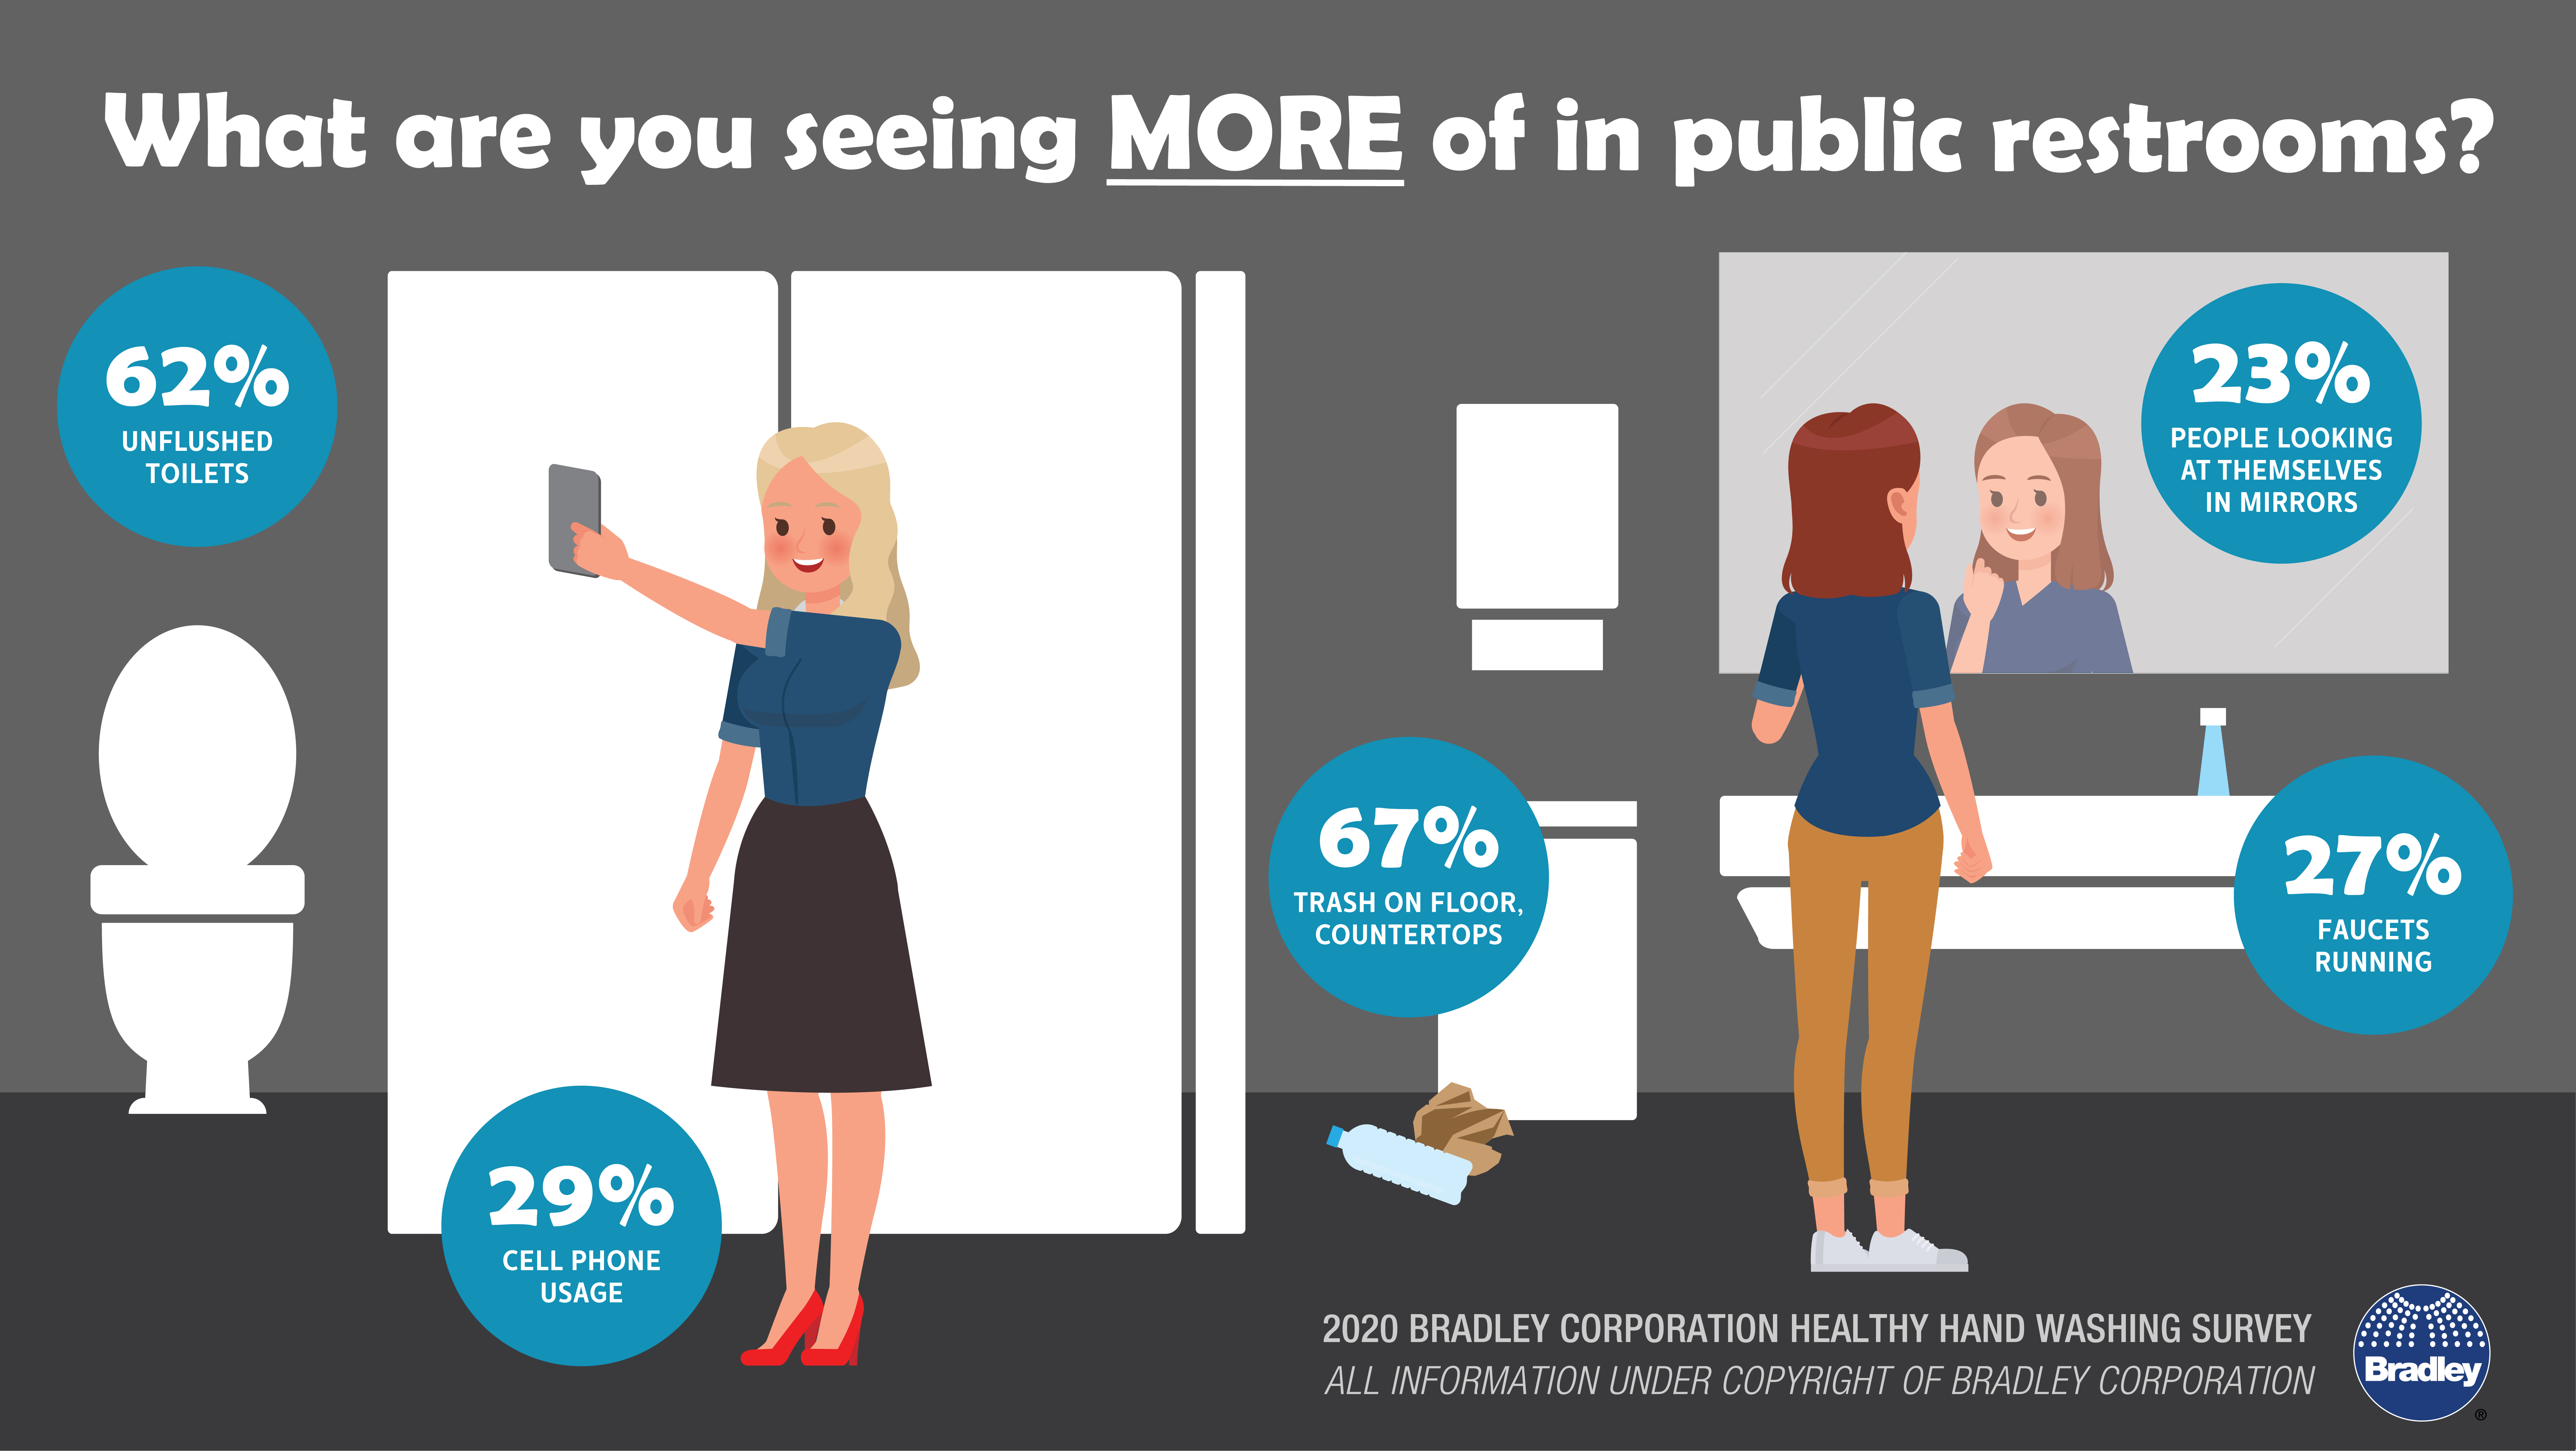
There are a number of grievances in public restrooms that trigger high levels of frustration. Among the most aggravating are clogged/unflushed toilets (85 percent), empty/jammed toilet paper dispensers (83 percent) and partition doors that don’t latch shut (78 percent). Women and Baby Boomers express the most annoyance about these inconveniences.
“Poor conditions are the main culprit behind people skipping hand washing during a restroom visit,” Dommisse noted. “Lack of soap and/or paper towels and dirty and/or non-functioning sinks are the two most common reasons for not washing hands.”
The 11th annual Healthy Hand Washing Survey by Bradley Corp. queried American adults and youth online Dec. 11-16, 2019. Participants were from around the country, were 14 years and older, and were fairly evenly split between men and women (47 percent and 53 percent).
Romance and Parenting
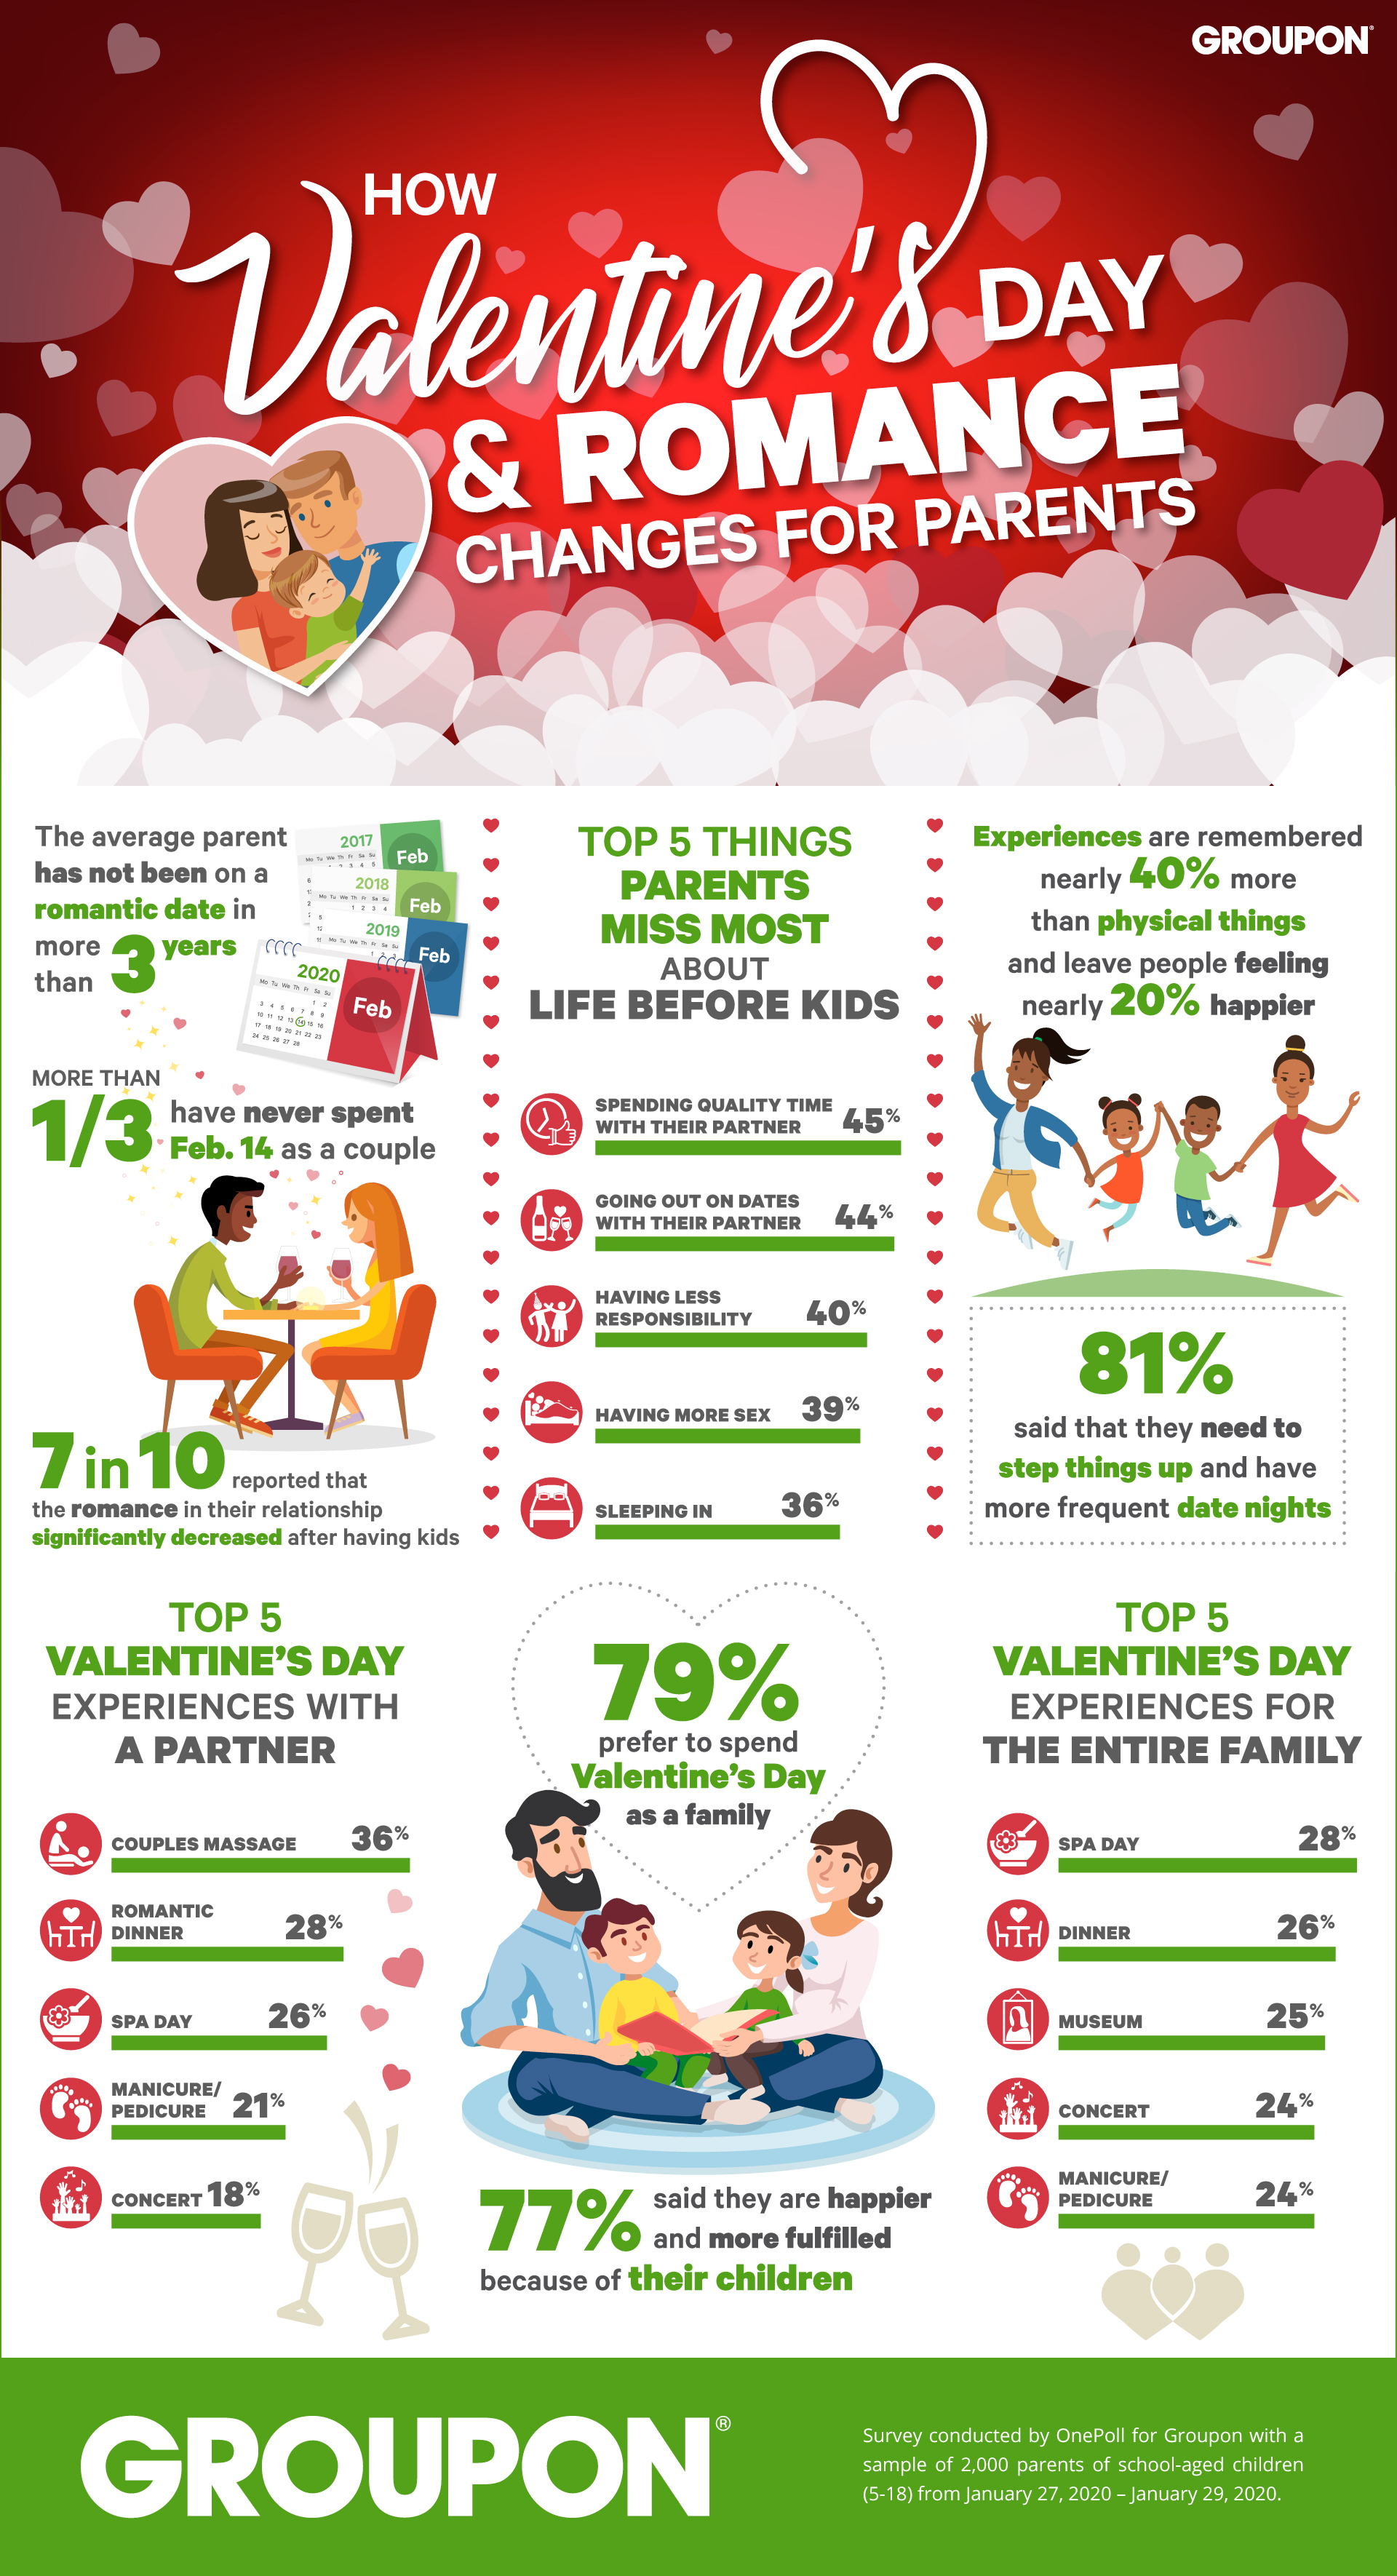
Valentine’s Day––the day for people to celebrate all of the loves in their life––begs the question: when was your last romantic date? Well for most parents it was more than three years ago, according to a new survey from local experiences marketplace Groupon that examined how things like romance and Valentine’s Day change for people after they have children.
The study of 2,000 parents found that seven out of 10 reported that the romance in their relationship significantly decreased after having kids, with more than half still longing for some of the freedoms they had before becoming parents. The top five things that parents miss the most after having kids were identified as the following: spending quality 1:1 time with their partner, going out on romantic dates, feeling carefree about life, having more sex and sleeping in.
Do these results mean that most parents are bitter about a reported decline in romance? Absolutely not! The Groupon and OnePoll study, found that most parents, 77 percent, said they are happier and more fulfilled because of their children. While 81 percent of parents said that they need to step things up and have more frequent date nights, 79 percent said they’d actually prefer it not be on Valentine’s Day because they prefer to spend the day as a family. In fact, more than one-third of parents have never spent February 14 as a couple.
“As parents, it’s great if we can pull off a romantic date night experience with our partner on Valentine’s Day. However, February 14 is also about celebrating all of our loved ones such as the kids, parents, friends and even treating ourselves,” said Groupon’s Head of Experiences Brian Fields. “And when it comes to finding the perfect gift for all of your loves, our research shows that experiences are remembered nearly 40 percent more than physical things and leave people feeling nearly 20 percent happier.”
The top Valentine’s Day experiences identified by parents of things they’d like to do with their partner, included: a couples massage (36 percent), romantic dinner (28 percent), spa day (26 percent), mani/pedi (21 percent) and a concert (18 percent). The top Valentine’s Day experiences parents identified for the entire family, included: a spa day (28 percent), dinner (26 percent), museum (25 percent), a concert (24 percent) and a mani/pedi (24 percent).
Groupon has a curated collection of ways you can celebrate who and what you love with this Valentine’s day with deals on experiences and gifts for your partner, children, friends and even yourself. To check out the entire Celebrate All Your Loves Groupon collection, click here..
Upscale Dating
Upgraded Points released details of their latest data study on 120 cities around the world, ranking them according to the cost of having an "upscale date" in each location.
For this study, an upscale date consisted of dinner for two including wine, tickets to the theater, after-theater drinks and full transportation to all venues. A total of 120 cities in the United States and abroad were included in the analysis.
Using aggregated data available from Expatistan and Numbeo, costs for a 3-course dinner including wine, 2 of the better-quality seats at a theater, 2 drinks at a bar and the total expected outlay for transportation were calculated and ranked by expense level.
The "Hidden" Cost of Traveling
According to Alex Miller, owner of UpgradedPoints.com, inexperienced travelers often fail to consider the costs associated with socializing and entertainment when calculating their travel budgets:
"We wanted to include this data study on our site because experienced travelers know that entertainment venue costs can vary enormously from one location to another. Many travelers make the mistake of looking only at their costs for flight and lodging. But anywhere you travel you are going to be eating, and for couples especially they need to carefully consider the expense of going to the theater, plays, restaurants and bars. You can shop wisely for travel and save a bundle – then blow your budget once you arrive and start having a good time."
The Most Expensive — and Least Expensive — Night Out Worldwide
Not surprisingly, New York City was found to be the most expensive location to have that upscale date – a whopping $565.56 total cost, which is $100 more than the number-two slot: Boston, Massachusetts, which came in at $424.88.
Third expensive was the city of Zurich, Switzerland ($424.88), a common destination for travelers because of its importance in the international financial and business community. Another well-known city, San Francisco, came in fourth in the rankings ($422.80), while another California city took 5th place: San Diego, which due to the high cost of theater tickets had a total cost of $408.88.
For couples looking to economize on their socializing, the five least expensive cities were found to be the city of Tunis, in Tunisia on the Mediterranean, with a calculated cost of $71.86, followed by Manilla in the Philippines ($71.16), Algiers the costal capital of Algeria ($70.62), Belgrade in Serbia ($69.60), and the least expensive of all: Alexandria, Egypt with an extremely low cost of $64.38.