
MRM Research Roundup: Mid-July 2019 Edition
14 Min Read By MRM Staff
This edition of Modern Restaurant Management (MRM) magazine's Research Roundup features Toast's comprehensive 2019 Restaurant Success Report, major growth in self-service offerings, lunch hour opportunities, top 10 Allergy-Friendly Independent Restaurants and who is winning the plant-based burger war?
Toast's 2019 Restaurant Success Report
The team at Toast released a state of the industry report surveying more than 1,000 customers and 1,000 restaurant industry professionals on their views on a number of hot-button issues affecting the industry today.
Among the key findings:
- Restaurant professionals ranked high operating and food costs and hiring staff as their top challenges to running a restaurant, with 52 percent citing high operating and food costs and 51 percent citing hiring staff. Training staff came in third with 35 percent of restaurateurs selecting it as a top challenge.
- 72 percent of guests said quality of food was important. 65 percent of restaurant professionals agreed, but they ranked value (i.e. well-priced menus) as the next most important criteria.
- Guests listed wifi availability, online reservations, and consumer ordering programs as restaurant technologies most important to their guest experience. Alternatively, restaurant professionals listed gift card programs, online ordering programs, and wifi availability as restaurant technologies most important to their businesses.
- To learn more, click here.
Restaurant Sales Slowdown
Restaurant sales came to a crawl during June highlighting the industry’s frequent traffic woes and bringing up new concerns for a sales slowdown during the second half of the year. Same-store sales growth was -0.01 percent year over year in June according to the latest Black Box Intelligence™ data from TDn2K™. This restaurant industry sales update is based on weekly sales from over 31,000 locations representing 170+ brands and nearly $72 billion in annual sales.
Same-store sales growth for the second quarter of 2019 was 0.2 percent, which represents a 0.7 percentage point drop from the growth rate reported for the first quarter. The industry’s sales growth has been decelerating since the beginning of the year. Average same-store sales growth for the last two quarters of 2018 was 1.3 percent, while the average for the first two quarters of 2019 is much lower at 0.5 percent.
“Although we would rather see strong positive sales growth consistently at 1-to-2 percent every month, the essentially flat sales growth during June and the small positive growth during the second quarter don’t indicate much change for the industry,'' advised Victor Fernandez, vice president of insights and knowledge at TDn2K. “The reality for the last ten years continues to be the same. Restaurants have suffered from declining guest counts, but the relatively stronger economy of the last two years has enabled rapidly accelerating guest checks to lift the industry into positive same-store sales growth. That pattern continues today, especially when analyzing the results from a longer time perspective.”
Although restaurant same-store sales growth has been positive for the last seven quarters (with the exception of the first quarter of 2018, when growth dipped to -0.1 percent), the drop in sales growth in the latest quarter may be a source of concern. But this slowdown seems to be largely a result of the industry lapping over tougher numbers a year ago. When compared with sales two years ago, same-store sales have been positive for the last three quarters.
Additionally, the first two quarters of the year posted exactly the same growth rate of 0.8 percent. When comparing sales over the two-year period, the slowdown in growth during the first half of 2019 disappears. Two-year same-store sales growth averaged 0.1 percent during the second half of 2018; the average for the first half of 2019 actually increased to 0.8 percent.
The Key to Solving the Problem Lies with Traffic
Same-store traffic growth was -3.1 percent during June, representing a 1.0 percentage point drop from May. Traffic growth for the second quarter was -2.9 percent, a 0.9 percentage point decline from the previous quarter’s result.
“As long as the industry is not able to at least hold on to current guest counts, achieving sustained same-store sales growth will not be possible, and we will likely continue to see anemic growth rates with 1.0 percent as a best-case scenario for sales,” said Fernandez. “Given the existing oversupply in the number of restaurant locations and the fact that, although growing at a slower pace than in recent years, chain restaurants continue adding to their net number of units, falling guest counts on a same-store basis will likely remain the norm in the near-term.”
Economy Still Slowly Growing with Modest Consumer Demand Expected
The economy continues to expand moderately, but the inconsistencies in the data are likely pointing to further easing in growth. “Job gains have bounced around but are slowing. The same is happening with vehicle sales. There has been limited improvement in housing sales and business investment remains tepid. The uncertainty over trade overhangs the economy. While a ‘cease fire’ between the U.S. and China has been called, there are few who expect a major breakthrough to occur anytime soon. Thus, it is likely that the days of 3.0 percent or more growth are behind us.” stated Joel Naroff, president of Naroff Economic Advisors and TDn2K economist.
“That said, now the longest expansion on record should be sustained through the remainder of the year, but at a pace closer to trend, approximately 2.25 percent. The implication is that consumer incomes, which are still not growing rapidly, will continue to lag. For the restaurant industry, that means demand should also expand somewhat modestly.”
Restaurants Dependent on To-Go Offerings to Grow Sales
The trend of consumers shifting more of their restaurant spending towards to-go offerings and away from dine-in continued during the second quarter of 2019. However, this trend has been accentuated recently. The last three quarters have seen the largest gap between to-go sales growth and dine-in sales; to-go has posted strong same-store sales growth, while dine-in has been declining for years.
“It is to-go sales that are lifting overall same-store sales into positive territory,” said Fernandez. “And those brands that are posting the best sales growth results tend to be those that are achieving much higher to-go sales than the industry overall.”
Workforce Dilemma Remains Unchanged, Staffing Still Top Concern
The extremely tight labor market continues to be a source of concern for restaurants, which has led to historically high turnover rates and an alarmingly high number of restaurant vacancies. Particularly troubling is the fact that, according to a recent survey by TDn2K’s People Report™, almost one out of every five restaurant companies said they are continuously understaffed for their general manager position. Given the large effect management turnover has on hourly retention and engagement, it is not surprising to find hourly turnover rates skyrocketing.
While restaurants continue to face challenges filling those vacancies caused by turnover, they also need to worry about recruiting for new restaurant locations. Since the end of last year, the industry has added jobs at a pace above 2.0 percent year over year every month. This has placed a lot of added pressure on restaurant staffing. Job growth was 2.2 percent in May.
It is not an easy task to solve the deep staffing challenges facing the industry today, but there are restaurant companies that have been simply better at tackling the people part of the business. What are they doing to achieve higher levels of retention and attract top talent? According to People Report analysis of the data, some of those solutions go beyond offering competitive pay and financial incentives (which definitely help). These top-performing brands are creating opportunities for personal and career development for their employees, offering employee recognition that is mindful of the employees themselves and their personal preferences, offering opportunities for enhanced work-life balance and working on creating a strong sense of purpose their workforce can align with and thrive.
Looking ahead to the rest of 2019, the expectation is for more of the same: declining traffic in comparable stores offset by rapid guest check growth, restaurants passing their rising costs into menu prices and consumers electing to spend more given the relatively strong consumer sentiment. All of this will only lend itself to small positive same-store sales growth as a result. In addition, the restaurant industry can anticipate continued challenges for restaurant staffing, driven by historically high turnover rates that don’t appear to be changing anytime soon.
Tillster's 2019 Self-Service Kiosk Index
Tillster is releasing its 2019 Self-Service Kiosk Index, showcasing major growth in self-service offerings from Quick Service and Fast Casual restaurants, and shifting consumer trends towards kiosks and self-service technology.
The demand for kiosks is growing. By 2024, the global kiosk market is expected to reach $30.8 billion. A significant portion of that growth comes from shifts towards self-service technology in the food and beverage industries. For QSR and Fast Casual establishments, kiosks help improve speed of service, increase average check, and maximize operational efficiency, and customers report appreciation for reduced wait times.
“Our index finds kiosks are rising in popularity among brands and consumers alike,” says Perse Faily, CEO of Tillster. “While kiosks may not be the right solution for all restaurants, in the appropriate settings, they build on a brand’s omnichannel experience and can allow for operational advancements. For winning brands, kiosks increase check size, improve speed of service and deliver mission-critical guest data.”
For the third consecutive year, Tillster partnered with esteemed research firm SSI to study how self-service kiosks impact guest behavior. Surveying 2,000 QSR and Fast Casual customers across the United States, the 2019 Self-Service Index’s key findings include:
Usage of Self-Service Kiosks Continues to Rise
QSR and Fast Casual restaurants can use kiosks to grow sales, increase throughput and prevent customers from leaving when lines are long. In both restaurant categories, customer usage of kiosks is up from last year.
Many Customers Prefer Kiosks to Cashiers
If line lengths were equal, 30 percent of customers would still prefer to order from a self-service kiosk. With a line longer than four people, that number rises to a majority.
Kiosks Remain Popular Across All Age Groups
Customers of all ages would visit more often if self-service kiosks were offered.
For complete survey data, download the Self-Service Kiosk Index here.
Top 10 Allergy-Friendly Independent Restaurants
AllergyEats announced its 2019 list of the Top 10 Allergy-Friendly Independent Restaurants in America. Released for the first time this year, this list is derived from the restaurant reviews of food-allergic diners across the U.S. on the AllergyEats app and website
The Top 10 Allergy-Friendly Independent Restaurants in America:
One Dish Cuisine, Café, Deli & Bakery (Ellicott City, MD)
Posana (Asheville, NC)
All Aboard Diner (Downers Grove, IL)
Bethany Blues BBQ (Bethany Beach, DE)
LuLu’s Destin (Destin, FL)
Food For Thought (Williamsburg, VA)
Big Fish Grill (Rehoboth Beach, DE)
Quartino Ristorante & Wine Bar (Chicago, IL)
Farmer’s Keep (Philadelphia, PA)
Skipper Restaurant & Chowder House (South Yarmouth, MA)
“AllergyEats congratulates the restaurants on this list for having earned the highest allergy-friendliness ratings from the food allergy community,” Paul Antico, Founder and CEO of AllergyEats said. “While no guarantee of a “safe” meal can ever be made, these are the restaurants where AllergyEats restaurant raters have had their best experiences, which is invaluable information when traveling. By publishing these lists, AllergyEats continues to further its mission of connecting diners with community-recommended restaurants while highlighting those that are consistently ranked best.”
Notably absent from this Top 10 list are restaurants west of Illinois. AllergyEats recently published an analysis of its user ratings demonstrating that restaurants in the western half of the U.S. are generally lagging their New England and Mid-Atlantic counterparts in properly accommodating the food allergy community by a significant margin (https://www.allergyeats.com/top-10-most-allergy-friendly-states-for-dining-out/). However, there are some standouts gaining a strong following in California, Arizona, and other western states, hopefully setting a new standard in their markets.
While this Top 10 list references only independent restaurants (with lunch and dinner service, at a minimum), visitors to the AllergyEats app and website can also find ratings and reviews of chain restaurants, ice cream shops and bakeries, Disney World dining options, and more.
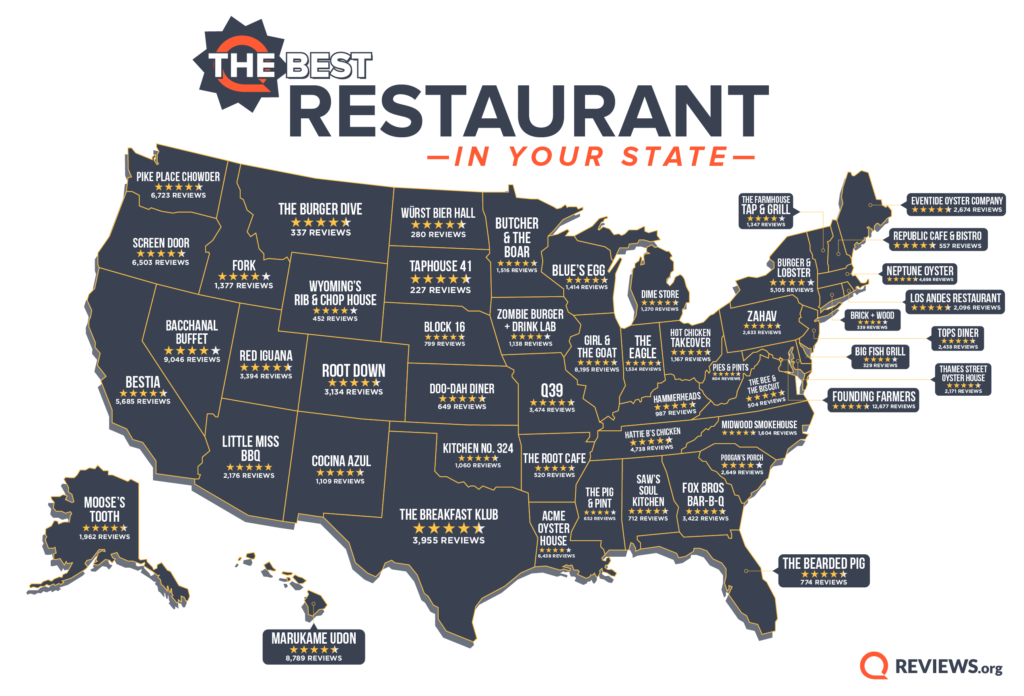
Top-Rated Restaurant in Every State
The team at Reviews.org put together a list of the top-rated restaurants in each state. Click here to read more about their process and analysis.
Lunch Opportunities
Location intelligence platform Ubimo, culled their database of over 12 million points of interest nationwide and 50 million unique anonymized devices daily to provide insight into restaurant type (fast casual, fast food, and sit-down) cuisine, most popular errands, and length of time spent, just to name a few, to show local marketers and big brands where opportunity exists during the lunch hour.
Not all cities’ lunchtime habits are the same. Washington D.C. is the city most likely to go out and grab food on their lunch break, as evidenced by the highest average increase in foot traffic to restaurants of 23.9 percent. San Francisco, on the other hand, sees only a minimal lift of 0.2 percent to restaurants around lunch. Individuals in Washington D.C. seem to go out for work lunches, while people in San Francisco may be opting for the free lunches that tech companies are known to offer. Other cities with high rates of lunch hour restaurant foot traffic are Dallas, at 20.8 percent and Atlanta, at 19.8 percent.
People are trying to stay healthy at lunch, salad places and cafes see large lunchtime crowds, while pizza places see either single digit lift increases or lift decreases. Salad chains are enjoying huge popularity, with places like Sweetgreen, Chopt, and Tender Greens boasting almost cult-like followings. With an average lift of 33.7 percent, salad-focused spots see the highest increase in foot traffic off all cuisines. Even San Francisco, the city that did not show much enthusiasm for lunch overall, sees a significant 44.3 percent lift increase to salad chains.
To read more, click here.
Impossible or Beyond?
New data from Gravy Analytics compares foot traffic at major restaurants and fast-food chains serving Impossible Burger and Beyond Meat products. One of the key findings: restaurants serving the Impossible Burger appear to generally outperform those serving Beyond Meat products year-over-year.
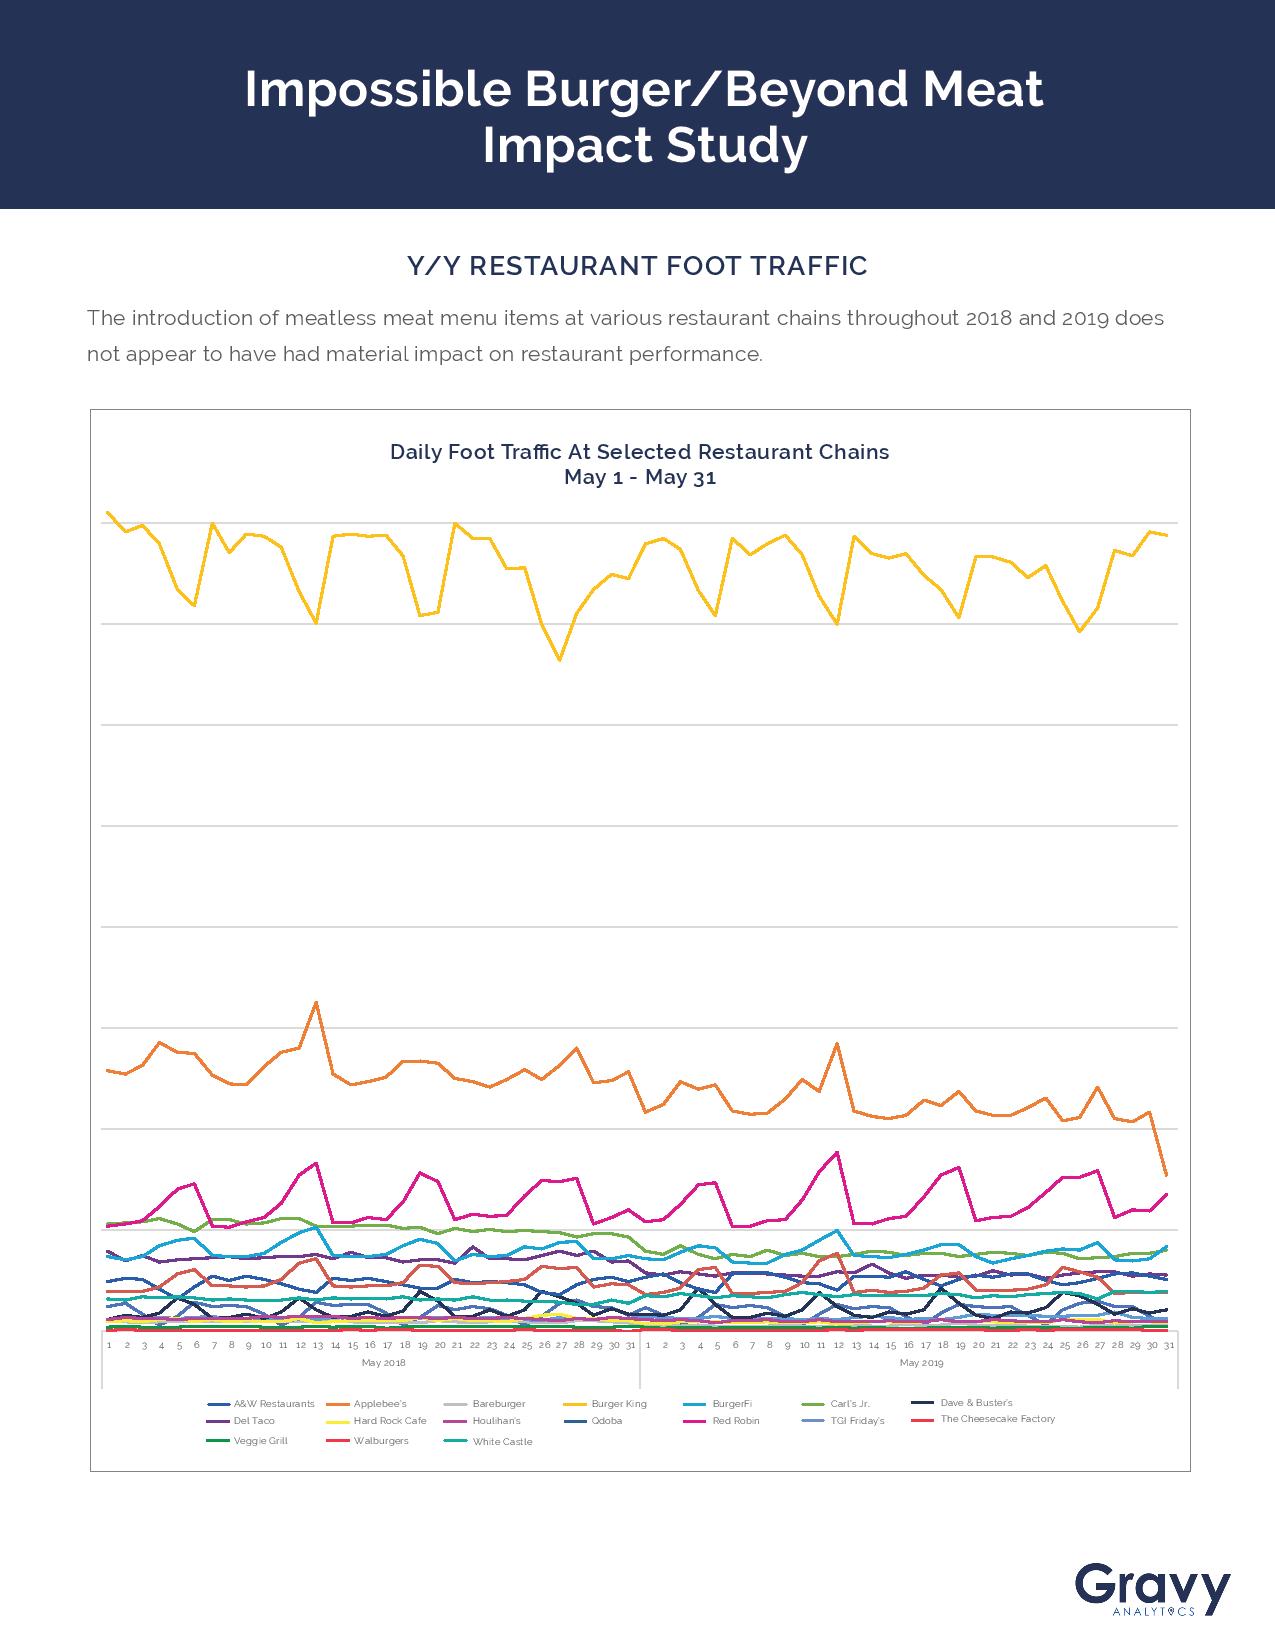
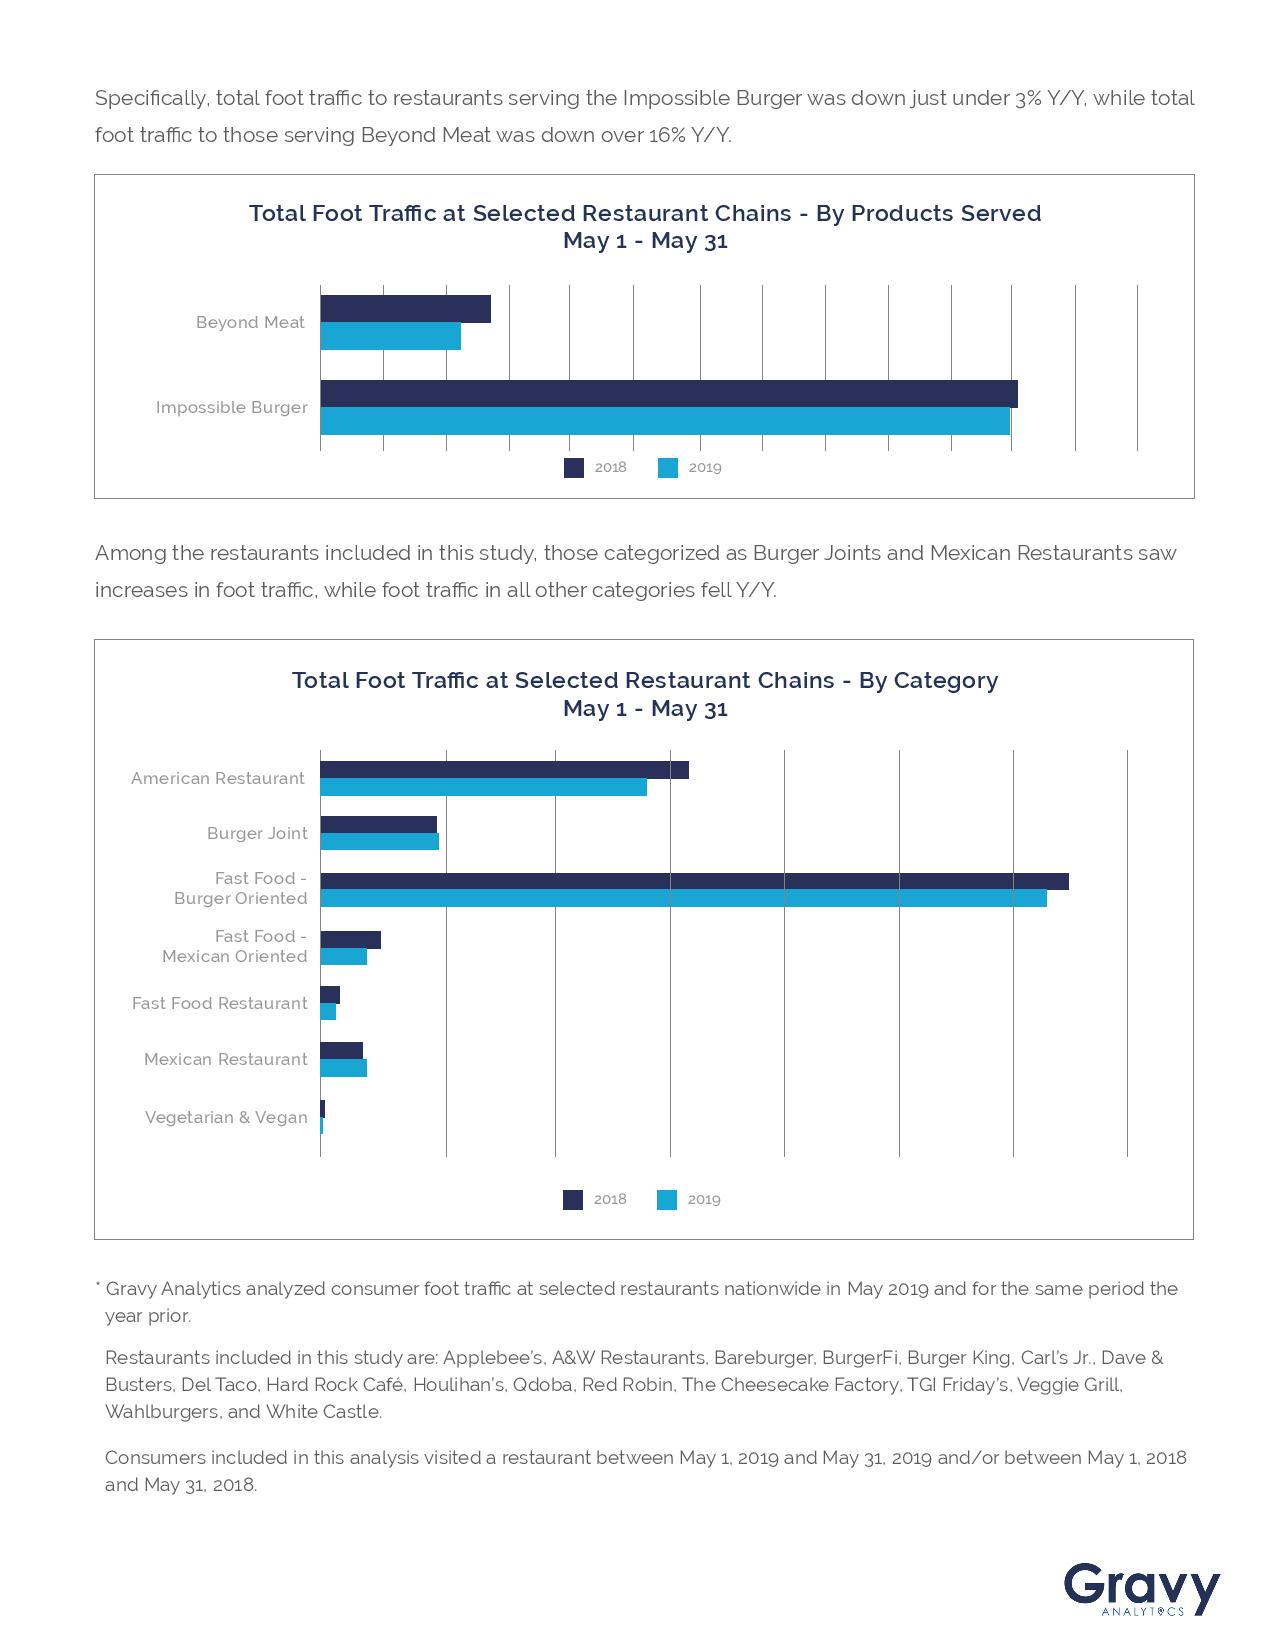
Restaurants included: Restaurants included in this study are: Applebee’s, A&W Restaurants, Bareburger, BurgerFi, Burger King, Carl’s Jr., Dave & Busters, Del Taco, Hard Rock Café, Houlihan’s, Qdoba, Red Robin, The Cheesecake Factory, TGI Friday’s, Veggie Grill, Wahlburgers, and White Castle.
Zeroing in on Restaurant Week Goers
Long Island Restaurant News polled 5,000 subscribers about their Long Island Restaurant Week experiences. The Long Island site dedicated to restaurants and dining conducted the poll from May 5th to May 12th 2019 to gather diner’s opinions and wishes as per Long Island Restaurant Week, Long Island’s most popular restaurant campaign.
Here are some of the results:
Almost half the respondents dine out multiple times a week (45.7 percent) or multiple times per month (47.31 percent). Just over a third (33.51 percent) order something not on the prix fixe. The vast majority of diners (90 percent) make a reservation with 56 percent utilizing Open Table. To see more poll results, click here.
The Importance of Online Reviews
Uberall, Inc., released new data on how small- and medium-sized businesses feel about online customer reviews across platforms like Yelp, TripAdvisor, Facebook, Instagram, Google and more. For the survey, more than 300 SMB owners were asked a series of questions about their relationship with customer reviews and the role they play in their overall business strategy.
Here’s a closer look at the results.
More than 90 percent of SMBs think online reviews are important
When asked how important SMB business owners thought online reviews were, 54 percent said “very important, while 28 percent believe said “moderately important.” In addition, 9 percent believe that online reviews are “slightly important” to their business and 9 percent don’t think they are important at all.
“Online reviews are essential to SMBs,” said Florian Huebner, Founder & Co-CEO of Uberall. “SMBs typically play in a crowded marketplace, making positive reviews a critical differentiator and a major lead-generation tool.”
63 percent of SMBs encourage customers to post reviews online
Asking customers to share an online review about their experience is a good way for smaller and mid-sized businesses to receive constructive feedback about someone’s experience. And today, more and more SMBs are asking for these reviews. Sixty-three percent ask customers to leave a review online — whether it’s positive or negative — while 37 percent do not.
“Business owners are clearly seeing the value in asking customers to leave reviews online once they’ve left the store or business,” Huebner said. “Both positive and negative reviews help businesses pinpoint which areas they need to adjust and which they can keep as is.”
86 percent respond to reviews — but frequency varies
Once a customer posts a review online, it’s up to the business whether they’re going to respond to it or not. And, it turns out, most of them do. According to Uberall’s study, 37 percent of SMBs always respond to online reviews, while 25 percent say they respond “frequently,” but not always. In addition, 26 percent say they “sometimes” respond and 14 percent never do.
And of those who respond to customer reviews, 81 percent respond to both positive and negative reviews, while 6 percent only respond to negative reviews and 12 percent only respond to positive reviews.
“A constructive dialogue between a business owner and customer is good for both parties,” says Huebner. “This interaction shows the customer that the business truly cares about them since they’re willing to have such a personalized conversation. For a business, their response could play a major role in whether or not they decide to return.”
Most SMBs respond to negative reviews to rectify a problem
When asked why an SMB would be likely to respond to a negative review, 32 percent said “to implement solutions to issues that are being clearly cited by customers as problematic.” Other responses were “to show other potential/future customers that we are attentive and care” (29 percent), “to discover quality control failures in your place of business” (20 percent), “to win back an unhappy customer” (20 percent) and “other” (1 percent).
“Negative reviews allow SMBs to see potential areas of their business where people think they can improve on,” Huebner said. “If a customer leaves a negative response, a proactive way for the SMB to minimize the damage is to respond to their concern or problem. Showing that they value their customers’ opinion presents a positive image and can ultimately help keep the business — or win more — in the future.”
83 percent respond to customer reviews within a few days
Uberall’s survey found that SMBs tend to respond relatively quickly to customer reviews. Forty-three percent respond “within a few days,” while 39 percent respond either as soon as they’re posted or within 24 hours. Other responses included “within a few weeks” (7 percent), “once a month” (5 percent) or “less than once a month” (6 percent).
“Most SMBs believe that responding to customer reviews while they’re new is a good way to show that they’re taking the customer seriously,” said Huebner. “Allowing time to go by before responding shows that they aren’t a high priority and can leave a bad taste in the customer’s mouth, costing future business and revenue.”
For Uberall’s SMB Customer Review Report, click here.
Top 10 Vegetarian and Vegan Friendly UK Cities Revealed
With a peaking interest in reducing our impact on the planet, vegan and vegetarian dining has been thriving across the UK in recent years, with the number of meat free restaurants undeniably increasing in cities across Britain.
A new study from catering equipment retailer Nisbets surveyed 1,000 UK based adults to explore dietary choices and how frequently they visit a restaurant or café which cater specifically to a vegan and vegetarian diet.
It’s evident that Brits are becoming increasingly conscious of what they eat, as the research found that 6.5 million UK adults are now ditching their meat-based meals and implementing a vegan or vegetarian regime instead.
In a bid to find the UK’s most vegan and vegetarian friendly city for eating out, Nisbets looked at Google search trend data and examined the number of searches around the term ‘vegan and vegetarian restaurants’ for several major cities across the UK, cross referencing the findings with the number of vegan and vegetarian restaurants listed per city, according to Happy Cow.
The UK’s top 10 vegetarian/vegan friendly cities:
1. Norwich
2. Edinburgh
3. Glasgow
4. Newcastle
5. Bristol
6. Manchester
7. Liverpool
8. Cardiff
9. Southampton
10. Nottingham
Norwich claimed the crown as Britain’s most vegetarian and vegan friendly city, with just 2,094 people in the city per vegetarian/vegan restaurant.
Scotland also proved to have a strong reputation as a meatless dining hotspot, with both Edinburgh (2,631) and Glasgow (3,000) laying claim to second and third place in the top ten.
Interestingly, despite 20 percent of Southampton residents sharing that they are either vegan or vegetarian, more than two thirds of those living in the city admit to never visiting vegan and vegetarian restaurants in their local area.
In contrast, 40 percent of Mancunians say they regularly pay a visit to one of the cities many vegan and vegetarian restaurants at least once a week, with Bristol residents not far behind (20 percent).
Despite its title as England’s capital and being renowned for its extensive choice of cuisine when eating out, London didn’t quite make the top ten, claiming stake to the number 11 spot on the list.
Opting for a vegan/vegetarian lifestyle was found to be most popular among 25-34-year-olds, with one in ten proudly identifying as such. However, despite the age difference, it appears that 65+ year olds are not too far behind, with one in ten taking on a flexitarian diet, severely reducing the amount of meat or meat related products they are consuming.
The study also found that a plant-based lifestyle is more popular among males than females, as more than twice as many men revealed they prefer this way of life. However, both sexes were found to enjoy this type of cuisine when dining out, as a whopping 5.8 million UK adults choose to visit solely vegan or vegetarian food outlets at least once a week.
The UK’s meat-free favorites when dining out:
- Vegetarian/tofu curry
- Stir fry with Quorn or tofu
- Cauliflower cheese
- Vegan macaroni cheese
- Mushroom risotto
- Spaghetti Bolognese with vegetarian mince
- Vegan nourish bowls
- Vegetarian/vegan burgers
Dean Starling, Head Development Chef at Nisbets, commented on the findings: “In an ever-growing socially conscious society we’ve seen an exponential increase in the rise of adults identifying as vegetarian or vegan, and as such, many caterers, restaurants and cafes have recognised this shift and are increasingly looking to up the amount of plant-based options they offer.
“It’s great to see that Brits are also increasing their support of the eateries in their local areas as they continue to grow their meat-free offerings, even when they’re not 100 percent vegetarian or vegan themselves. The prevalence of vegan and vegetarian food in society is undoubtedly becoming more widespread, and as more people want to diversify their diet, we predict that this particular lifestyle will only continue to prosper. We can’t wait to see where it goes to next.”