
MRM Research Roundup: Mid-June 2019 Edition
20 Min Read By MRM Staff
This edition of Modern Restaurant Management (MRM) magazine's Research Roundup features a sharp fall for the National Restaurant Association’s Restaurant Performance Index, how Pride Month impacts the hospitality industry, the state of specialty food and the best wine restaurants in the United States.
Restaurant Performance Index Falls
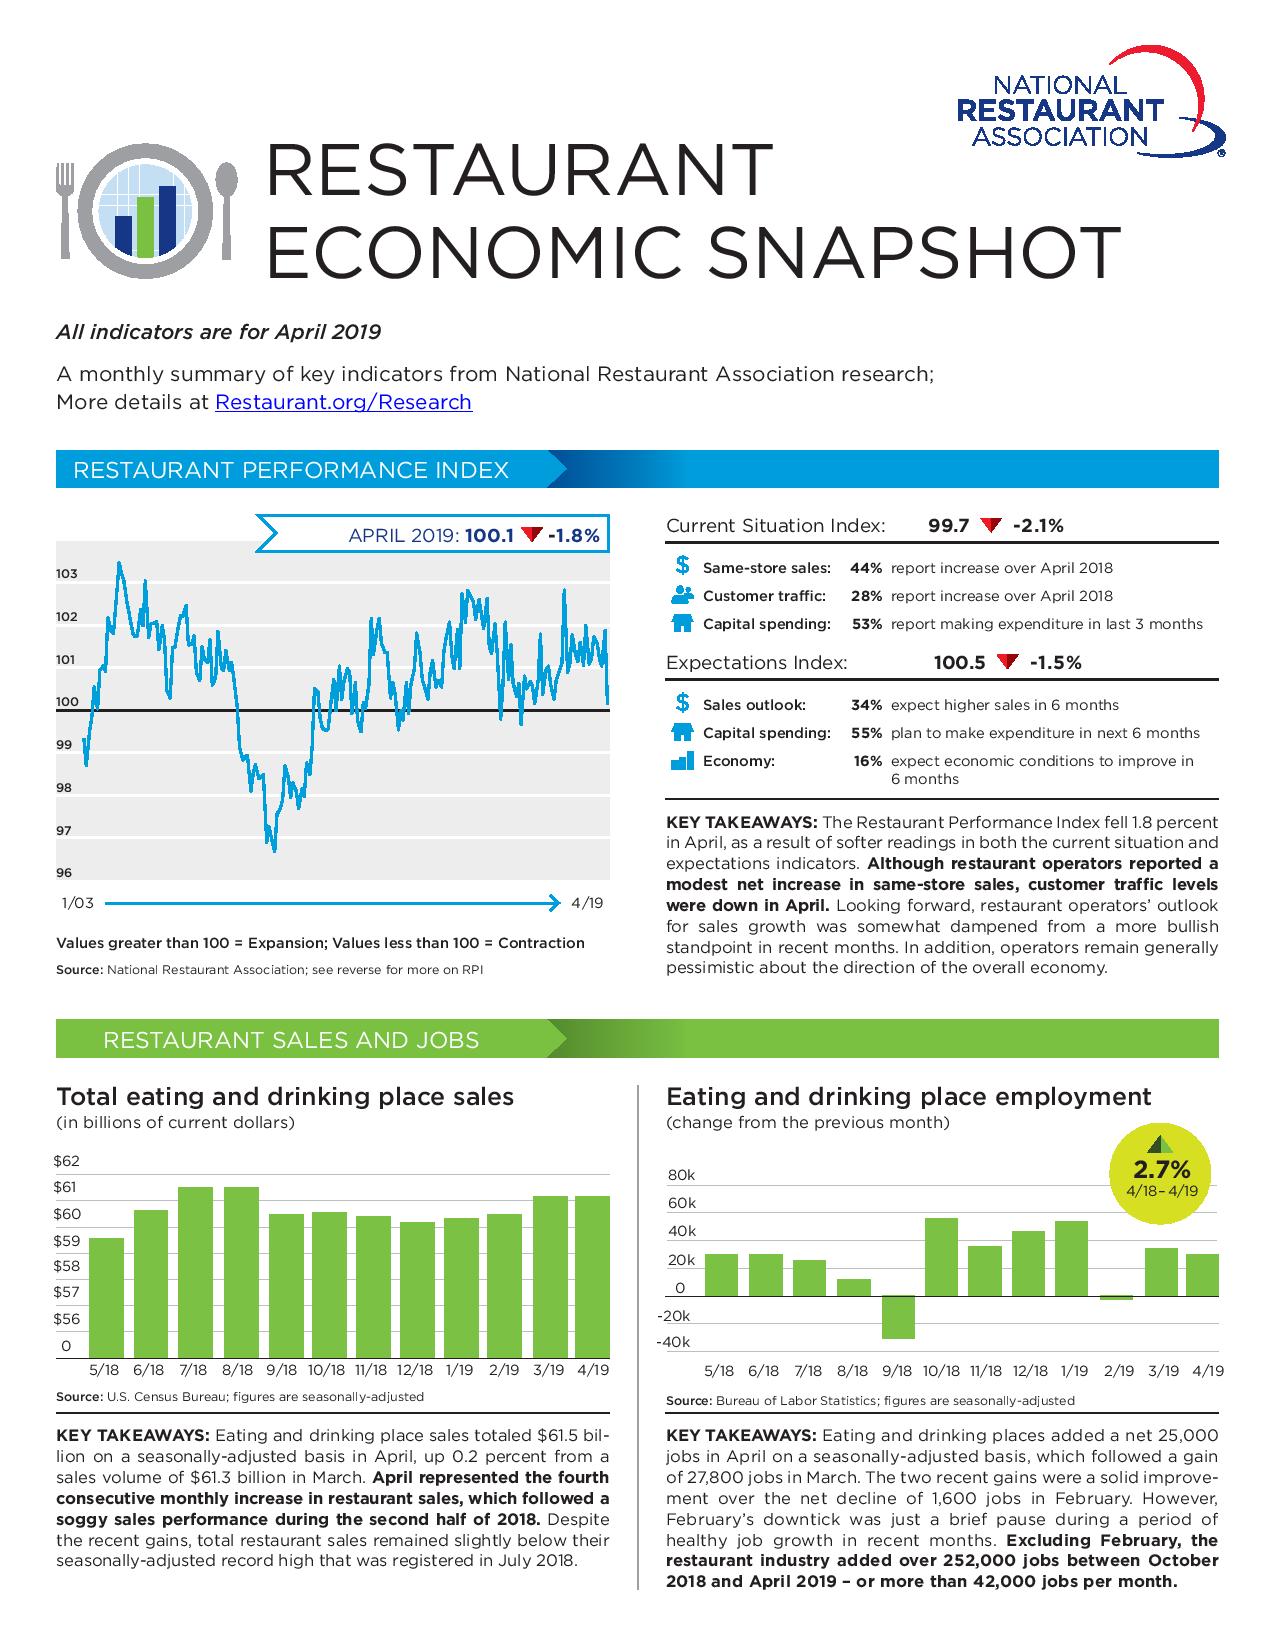
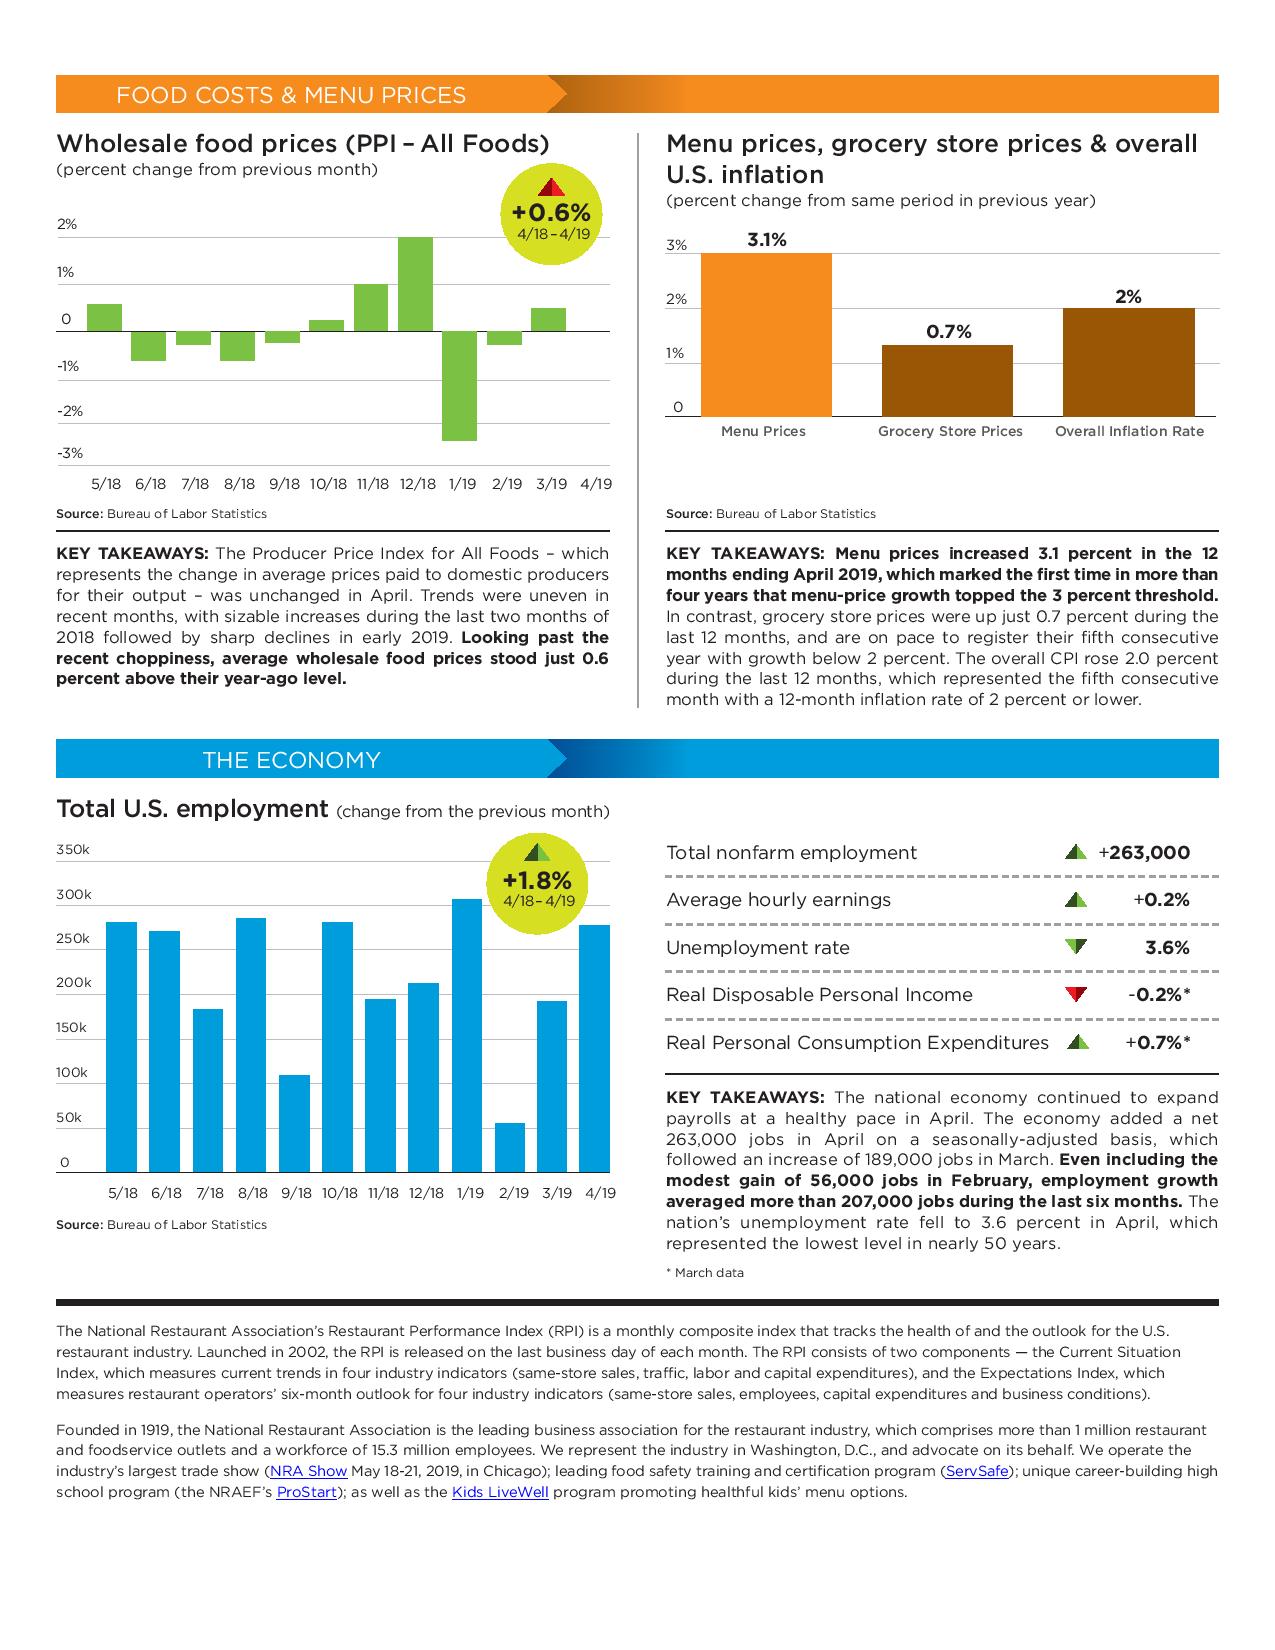
As a result of softer readings in both the current situation and forward-looking indicators, the National Restaurant Association’s Restaurant Performance Index (RPI) fell sharply in April. The RPI – a monthly composite index that tracks the health of and outlook for the U.S. restaurant industry – stood at 100.1 in April, down 1.8 percent from a level of 101.9 in March.
April’s RPI decline was the result of broad-based softening in both the current situation and expectations indicators. Although same-store sales readings were slightly positive in April, customer traffic turned negative. In addition, restaurant operators are less optimistic about both sales growth and the overall economy.
The RPI is constructed so that the health of the restaurant industry is measured in relation to a neutral level of 100. Index values above 100 indicate that key industry indicators are in a period of expansion, while index values below 100 represent a period of contraction for key industry indicators. The Restaurant Performance Index consists of two components – the Current Situation Index and the Expectations Index.
Operators Reported Softer Same-Store Sales and Customer Traffic in April
Although restaurant operators reported a modest net increase in same-store sales, the April readings were significantly dampened compared to recent months. Forty-four percent of restaurant operators reported a same-store sales increase between April 2018 and April 2019, down from 60 percent in March and the lowest level in 11 months. Thirty-nine percent of operators reported a sales decline in April, up from just 22 percent in March.
Restaurant operators also reported softer customer traffic levels in April. Only 28 percent of restaurant operators reported an increase in customer traffic between April 2018 and April 2019, down from 48 percent in March and the lowest level since September 2018. Fifty percent of operators reported a decline in customer traffic in April, up from 30 percent in March. This represented the highest proportion of operators reporting lower customer traffic levels since January 2018.
Although sales and customer traffic levels were dampened, capital spending activity remained on trend. Fifty-three percent of restaurant operators said they made a capital expenditure for equipment, expansion or remodeling during the last three months, a level that has remained relatively steady for the past few months.
Restaurant Operators are Less Optimistic about Sales Growth and the Economy
Restaurant operators’ outlook for sales growth was dampened compared to recent months. Thirty-four percent of restaurant operators expect to have higher sales in six months (compared to the same period in the previous year), down from 47 percent last month and the lowest level in seven months. Nine percent of restaurant operators expect their sales volume in six months to be lower than it was during the same period in the previous year, while 57 percent of operators think their sales volume will remain about the same.
Meanwhile, restaurant operators remain uncertain about the direction of the overall economy. Only 16 percent of operators said they expect economic conditions will improve in six months, up slightly from 12 percent who reported similarly last month. Twenty-three percent of operators think economic conditions will worsen in six months, while 61 percent expect conditions to remain about the same.
Even though restaurant operators are less optimistic about sales growth and the economy, a majority of them continue to plan for capital spending in the coming months. Fifty-five percent of restaurant operators plan to make a capital expenditure for equipment, expansion or remodeling in the next six months, down from 61 percent who reported similarly last month.
Current Situation Index Fell 2.1 Percent in April to a 105
The Current Situation Index, which measures current trends in four industry indicators (same-store sales, traffic, labor and capital expenditures), stood at 99.7 in April – down 2.1 percent from a level of 101.8 in March. The sharp April decline gave back all of the gains registered in March, and dropped the Current Situation Index to its lowest level since January 2018.
The Expectations Index, which measures restaurant operators’ six-month outlook for four industry indicators (same-store sales, employees, capital expenditures and business conditions), stood at 100.5 in April – down 1.5 percent from a level of 102.1 in March. April’s decline came on the heels of four consecutive gains in the Expectations Index, and represented its lowest level in nearly two years.
Restaurant Roller Coaster Ride
The roller coaster the restaurant industry has been riding since the beginning of the year showed no signs of stopping in May. After a disappointing April, restaurant same-store sales returned to positive territory with a strong 1.1 percent growth. This represented a robust 1.6 percentage point rebound compared with last month’s year-over-year growth rate. These insights come from Black Box Intelligence™ data from TDn2K™, based on weekly sales from over 31,000 locations representing 170+ brands and nearly $72 billion in annual sales.
“As we expected, May ratified that the relative strength continues for restaurants when it comes to sales momentum,'' said Victor Fernandez, vice president of insights and knowledge for TDn2K. “What is even more encouraging for the industry was that in a month relatively free of external factors, such as winter storms and holiday shifts which have muddied the results in recent months, restaurants were able to post some encouraging sales growth.”
Furthermore, sales growth during May was positive compared with the same month two years ago. Two-year same-store sales growth has been positive during seven of the last eight months. The only exception was February, largely attributed to the negative effect of weather. This longer-term recovery is welcome news for an industry struggling with market oversaturation and increased competition.
Guest Counts Continue to Drop for Most Brands
However, there are still some concerns regarding the health of the industry. On one hand, same-store traffic continues to decline, as has been the trend since the recession. It is only through an acceleration of guest check growth that the industry continues to achieve positive sales. On the other hand, there are some concerns on the macroeconomic horizon that could put a halt to this momentum.
It should come as no surprise that the industry’s year-over-year same-store guest counts dropped again. Same-store traffic during May was -2.1 percent. Although this represented a 1.5 percentage point jump from April’s growth rate, it is far from where restaurants would like to be.
Concerns for Economic Slowdown Fueled by Trade War Fears
“After growing strongly for nearly a year, the economy has entered a period of significant uncertainty, created by the escalation of the use of tariffs to include not just China, but also Mexico,” stated Joel Naroff, president of Naroff Economic Advisors and TDn2K economist. “Our two largest trading partners are being pressured and that affects business and consumer costs. But the issues are not limited to trade. Business fears of a tariff-induced slowdown are restraining capital investment.”
“Consumer spending growth has become inconsistent, in part because wage gains are moderating. And while job increases have been solid, it looks like that could be waning as well. Despite these factors, the economy is not faltering. There is, though, less certainty that growth will be sustained at the strong levels seen recently. Indeed, the outlook is for the expansion to continue at a more modest pace. That should be enough to keep consumers spending, but again, not nearly as solidly as we have experienced this year – unless the trade uncertainties are resolved quickly.”
Industry Experiencing Record High Turnover Rates
Staffing continues as one of the primary challenges for restaurant operators. The current period of sustained job growth and low unemployment resulted in record high turnover rates across the industry. This high demand for workers is also leading to increased wage pressures, a further strain on labor-intensive, and often low margin, businesses such as restaurants.
According to the People Report Workforce Index™, a quarterly barometer of market pressures on employment in the restaurant industry, more than half of restaurant companies reported an increase in difficulty recruiting qualified employees in recent months. Vacancies also continue to be a heightened challenge, particularly at the hourly level. Additionally, there have been reports of locations closing due to the inability to adequately staff their locations.
So, What Do Successful Brands Do that is Different?
While undoubtedly facing challenges as everybody else, brands in the top quartile of sales growth performance typically achieve positive traffic growth. TDn2K research has shown growing guest counts is possible; but, it comes from a combination of staffing for excellent and consistent execution, a superior service experience at all levels, attention to detail and activating growth engines beyond traditional dine-in sales during lunch or dinner.
“This requires an investment in winning the staffing challenges for great talent, retention of the best general managers and a culture of collaboration and genuinely caring about the balance of the employee, the guest and all stakeholders. That is how best-in-class brands drive positive traffic. The employees want to come to work, the guests want to come back and investors want to invest for growth,” concluded Wallace Doolin co-founder and chairman of TDn2K.
Prideful Searches
June is LGBT Pride Month. Celebrations occur throughout the month in most major cities, with New York City and San Francisco particularly famous for their parties and parades. Inspired by this historic occasion, Yext has conducted some research on how consumer search behavior changes during Pride, based on results from Pride 2018.

They’ve found:
Event venues in San Francisco saw the largest increase in engagement the weekend of the Pride March — Google Direction Clicks increased by 156 percent compared to the weekends prior.
New York City clubs and other nightlife venues saw an increase of 53 percent in Google Phone Calls and 107 percent in Google Direction Clicks on the weekend of the Pride March compared to the weekends prior.
Google Direction Clicks for hotels in New York rose 18 percent week over week on the day of the Pride March. Similarly, Google Direction Clicks for hotels in San Francisco rose 37 percent week over week on the Sunday of the Pride March.
Where’s the Party?
Event venues in San Francisco saw the largest increase in engagement the weekend of the Pride March — Google Direction Clicks increased by 156 percent compared to the weekends prior. In New York City, clubs and other nightlife venues saw an increase of 53 percent in Google Phone Calls and 107 percent in Google Direction Clicks on the weekend of the Pride March compared to the weekends prior.
Let’s Get Dinner. Restaurants in New York saw a year over year increase of 35 percent in Google Search Views, and a 112 percent increase in Google Website Clicks. Similarly, restaurants in San Francisco saw a year over year increase of 39 percent in Google Search Views, and a 96 percent increase in Google Website Clicks.
How About a Drink? Google Phone Calls for bars and pubs in New York rose 132 percent week over week on the day of the Pride March. Liquor stores in New York also saw a boom in visibility and engagement during the Pride March weekend — Google Search Views and Google Direction Clicks were up 85 percent and 80 percent, respectively, compared to weekends prior.
To learn more, click here.
State of the Specialty Food Industry Report
The Specialty Food Association’s (SFA) annual State of the Specialty Food Industry Report, reveals that specialty food remain one of the fastest-growing segments of the food business. Fueled by increasing interest from both consumers and retailers, total sales jumped 9.8 percent between 2016 and 2018, reaching $148.7 billion last year.
Specialty food sales outpaced the growth of all food at retail – up 10.3 percent vs. 3.1 percent. Product innovation and the wider availability of specialty foods through mass-market outlets is playing a part in the industry’s success. Sales through foodservice represented 22 percent of sales, with retail taking the top spot with 76 percent of sales. While online represents less than three percent of sales, it has grown 41 percent since 2016.
“Diverse consumer lifestyles are taking specialty foods mainstream,” said Phil Kafarakis, president of the SFA. “To reach these consumers and increase their own sales, food merchants have embraced the vast assortment of specialty products. Our research outlines the momentum in the industry and provides a comprehensive picture of where we are today and how businesses can prepare for the future. Conducting important research like this is a part of our mission to champion specialty foods and help our members continue to innovate and succeed.”
The SFA combines its annual research into a single, comprehensive State of the Specialty Food Industry report. Working with Mintel, the report explores where the current market stands, the opportunities and challenges it faces, where it is going based on sales forecasts in key categories, and how the specialty food consumer is evolving.
Key Facts and Figures:
Top Five Categories with Highest Dollar Growth
- Refrigerated Plant-Based Meat Alternatives
- Rice Cakes
- Frozen Plant-Based Meat Alternatives
- Water
- Refrigerated RTD Tea and Coffee
Top Five Categories – Retail Sales
- Cheese and Plant-Based Cheese
- Frozen, Refrigerated Meat, Poultry, Seafood
- Chips, Pretzels, Snacks
- Non-RTD Coffee and Hot Cocoa
- Bread and Baked Goods
Share of Consumers Buying Specialty Foods by Generation (2018)
- Gen-Z – 66 percent
- Millennials – 84 percent
- Gen-X – 75 percent
- Baby Boomers – 69 percent
Top Seven Take-Aways
- Plant-based is going strong
- Specialty beverages are increasingly a force in the market
- Younger consumers don’t look to supermarkets for quick meals
- Reduced packaging and food waste are hot points
- The C-store channel is an under-tapped market for specialty items
- Foodservice needs to move to greater customization
- Opportunity lies in breakfast
These highlights, as well as a full report can be found here.
Top Food Trends
Mintel named the flavor and ingredient trends that are influencing the foodservice and packaged food and drink categories in 2019 and beyond. The five new trends link the relationship between consumer behavior and food and drink to dishes on restaurant menus and products on store shelves, and explain the significant momentum that has led to this moment.
Seeking out ingredients that provide sustenance for healthy eating is top of mind for Americans. However, consumers today are also looking beyond the balanced diet. Flavors that tap into relaxation and support a healthy gut are satisfying consumers that are looking for ingredients that will feed the mind, body, and soul.
Melanie Zanoza Bartelme, Global Food Analyst at Mintel, said: “We’re seeing Ayurvedic-inspired ingredients and adaptogens, botanical flavors and cannabidiol, or CBD, appearing in more packaged foods and drinks. At the same time, foodservice operators are getting creative with these flavors and ingredients in menu items. And it’s all in the name of stress release. With cannabis now legal in several US states, and industrialized hemp production legal nationwide, consumer curiosity in alternative forms of relaxation is piqued.
“As Americans begin to understand the link between fermented foods and health, we’re seeing restaurants and retail brands turn to lesser-known or ‘old-fashioned’ fermented foods, like drinking vinegars, kimchi, and kombucha, as well as newer fermented foods derived from soybeans, including miso. Prebiotics – familiar to some via vitamins and supplements – are lesser explored in current product innovation and menu offerings, but we expect these ingredients to grow in popularity over the coming years.”
Building on 2018 Flavor Trends, international flavors are examined from the Eastern Mediterranean, India, and Japan, exploring the spirited and unconventional avenues that have driven these unique flavors and ingredients to dishes and products in the US.
Amanda Topper, Associate Director, Foodservice Research at Mintel, said:“More varied Mediterranean ingredients and flavors are expanding consumers' palates and along with them the possibilities for Middle Eastern food. Americans are widely familiar with staple Middle Eastern foods like hummus, falafel, and zhug; because of this, consumers are becoming more receptive to regional, specialized flavors from specific Eastern Mediterranean locations like Israel, Yemen, Lebanon, and Syria.
“Over the past few years, Indian cuisine has entered the spotlight. Americans are now familiar with menu items like masala, having eaten Indian food at fast-casuals, food trucks, and pop-up restaurants. Our research shows that while Indian fare is starting to mainstream in many parts of the country, there is still significant opportunity for dishes and products that explore the regional specialties of India.
“Traveling east to Japan, we’re observing US restaurants and retailers drawing on the popularity of Japanese foods and ingredients like sushi, ramen, and matcha, especially as they become increasingly popular on social media due to their unique and ‘Instagrammable’ colors, formats, and presentation on the plate. With Japanese street food appearing more and more in the media, and tourism to Japan on the rise, we expect to see an even greater focus on Japanese flavors and ingredients this year.”
Demand for Cashless Options
A study commissioned by Transaction Network Services (TNS) consumers expressed their openness to embracing alternative payment options, including the use of wearables and smartphones. However, acceptance of cashless payments comes with a high degree of concern surrounding the ability to secure these devices.
TNS’ study, Consumer Differences Shape Alternative Payments and Cashless Systems Adoption,* surveyed more than 3,000 consumers in the United States, United Kingdom and Australia. It explores their attitudes toward making payments on wearables, mobile apps and cashless systems as well as the role of cash in the payments mix. The study illuminates differences in opinion across geographic location, age groups, and gender, and also highlights the anxiety consumers have about security.
Some of the significant findings of the report are:
- 44 percent of respondents are willing to make a payment using a wearable device like a ring or a bracelet;
- Just under two-thirds (65 percent) expressed that security concerns would stop them from using a wearable device to make a payment;
- Australians are most concerned about security (68 percent), versus Americans (64 percent) and Britons (63 percent);
- More than half of male smartwatch owners have used it to make a payment;
- A majority of respondents (55 percent) like using mobile payment apps on their smartphone to make payments because they are quick and easy. US adults are the highest adopters here with 59 percent preferring the convenience of mobile payment apps;
- Only 60 percent of US respondents made on average at least one contactless payment each week, as compared to 75 percent of Australians and 79 percent of Britons; and
- When asked about cashless systems specifically in a university setting, 73 percent of adults said that this was preferred over carrying cash, locating an ATM, or having the right change for a machine.
“This initial study reveals a promising trend for alternative payments,” said Bill Versen, Chief Product Officer for TNS. “Mobile and wearable devices are demonstrating strong acceptance, and TNS believes this trend will only accelerate as the technology becomes more pervasive.”
But the report also revealed that security remains a concern. “Merchants need to continue to invest in and deploy payment systems that protect against data breaches,” commented Versen. “As the report illustrates, a lack of security is really the only gating factor to enabling a wider adoption of cashless payments.”
TNS’ report is available to download here.
America's 100 Best Wine Restaurants of 2019
Wine Enthusiast announced the annual edition of its ‘America’s 100 Best Wine Restaurants’ list just in time to kick off summer. Curated exclusively by a Wine Enthusiast team of experts, the 2019 edition is comprised of over 15 first-time winners from across the country representing major cities and exciting secondary markets, in celebration of the best of the best wine and dining experiences. T
‘America’s 100 Best Wine Restaurants’ list showcases unrivaled wine and dining experiences that span across the nation. The vast compilation features classic establishments offering a refined wine and dining program and also sheds light on some of the country’s rising stars, helping put secondary markets on the culinary map. Far beyond a tally of 100 restaurants, this list congratulates the dynamic people who make it all possible and push boundaries that are helping shape dining culture.
“Our ‘America’s 100 Best Wine Restaurants’ list is one of my favorite packages we release each year,” says Susan Kostrzewa, Executive Editor of Wine Enthusiast. “It’s filled with excitement and promise as we are truly in the midst of an energetic and creative time in wine and dining. From exceptional, innovative wine lists to truly progressive cuisine, the talented chefs, sommeliers and beverage directors across the U.S. continue to amaze me and exceed my expectations year after year.”
Newcomers to the annual list include Niche Niche and Racines in New York, NY; Theodore Rex in Houston, TX and Folk in Nashville, TN; complemented by veterans such as Atelier Crenn in San Francisco, CA; Oriole in Chicago, IL and Borolo Grill in Denver, CO. A full list of America’s 100 Best Wine Restaurants online available here.
Wine Enthusiast’s Restaurant Hall of Fame spotlight, which features restaurants that have been included on the 100 Best Wine Restaurants list for four or more years, will appear for its second year in the print edition. Also in print exclusively, the package includes Q&As with leading chefs and sommeliers as well as a sampling of recipes and wine pairings from several of the 2019 winners.
Lifestyle Secrets of Today's Hourly Workers
The inaugural Branch Report takes a look at the financial, work, and lifestyle interests of today’s hourly workers. In surveying over 3,000 hourly employees across a variety of sectors including retail, food service, and healthcare, the report found that nearly 70 percent (69.4 percent) were optimistic about their job prospects, more so than the state of the economy (50.1 percent).
Hourly workers were twice as interested in using their work experience to earn a promotion at their current employer (31.9 percent) rather than switching jobs (15.7 percent), but they were overwhelmingly more likely to turn to their family (39.5 percent) than their managers (14.6 percent) for career advice. Over 70 percent of hourly employees (71.5 percent) also admitted they did not have a LinkedIn profile, just a traditional resume.
“Even with the demand for hourly employees at an all time high and having their pick of employers, more hourly employees are looking to grow within their current company rather than switch,” said Branch CEO Atif Siddiqi. “But there’s a vast disconnect between employees’ career development and their employers. Employers have a tremendous opportunity to retain their employees by providing tools that can help them increase earning potential and financial stability. In seeing the limited financial advancement resources for hourly workers, we’ve expanded our product to offer more ways to bridge this divide.”
Findings also reinforce the challenges hourly employees face in meeting both short-term and long-term financial goals. Over 75 percent of respondents reported less than $500 saved for their emergency funds (75.8 percent), with 40 percent of total respondents admitting they had $0 saved for an emergency. For most hourly employees, basic living costs such as home affordability (58.4 percent) and utilities (47.1 percent) were their main concerns. This differed for employees age 50 and over — 82.2 percent cited medical costs as their top financial worry, followed by retirement (64.3 percent). Prioritizing retirement grew with age, but male hourly employees across generations considered retirement a financial concern at significantly higher rates than their female counterparts.
"Because earnings are directly tied to the number of hours worked, unstable, unpredictable hours can undermine financial security for workers of all ages,” said Dr. Susan Lambert, Associate Professor in the School of Social Service Administration at the University of Chicago. “The findings of the Branch survey are consistent with other research indicating that many hourly workers desire more stable and predictable work hours."
Additional findings include:
Financial Concerns
Hourly workers cited affording basic living costs as their top financial concerns — over half cited Home/rent affordability (58.4 percent) as their top concern, with almost just as many renting (56.6 percent).
– Just 16.5 percent contributed to a mortgage, while over a quarter lived with friends or family for free (26.9 percent).
– Following Home/rent affordability, Utility Bills and Groceries were the second and third top concerns respectively (47.1 percent and 42.4 percent).
– Their concern for meeting day to day needs may also be why almost 80 percent of hourly employees said accessing their pay before pay day would be helpful (79.6 percent).
Work Priorities
Beyond higher wages, scheduling stability and flexibility were top factors, with more than half wanting a stable, predictable schedule (57 percent) and almost 40 percent wanting greater scheduling flexibility and control over when they worked (38 percent). A positive work culture also ranked high on the list with 49.7 percent of respondents citing it as a top factor:
– Higher wages – 63.4 percent
– A stable predictable work schedule – 57 percent
– Positive work culture – 49.7 percent
– Scheduling flexibility – 38 percent
– Supportive managers – 35.7 percent
– Supportive team members – 32.1 percent
– Add’l hours of work – 24.1 percent
Higher wages were also top of mind within their current employment situation, but a promotion at work was a close second. Hourly workers were twice as interested in using their work experience to earn a promotion at their current employer (31.9 percent) rather than switching jobs (15.7 percent):
– Higher pay – 36.5 percent
– Promotion at this company – 31.9 percent
– Gaining work experience to switch industries/ occupations – 15.7 percent
– Professional development and training – 8.8 percent
– Employee perks + discounts – 5 percent
– Qualifying for health benefits – 2.2 percent
When it came to keeping their resumes fresh, most hourly employees updated them at least once a year (42.5 percent). Nearly a quarter updated their resumes every couple of years (22.8 percent) and about half of that updated their resumes every month (11 percent). While nearly a quarter also said they didn’t have a resume (23.4 percent), almost three times as many didn’t have a LinkedIn profile (71.5 percent).
As for their top career advice resources, family was overwhelmingly their top source (39.5 percent), with manager at work a distant second (14.6 percent):
– Family – 39.5 percent
– Manager at work – 14.6 percent
– Internet -13.6 percent
– Work colleagues – 12.1 percent
– Friends – 10.5 percent
– School – 8.3 percent
– Career books – 1.5 percent
Lifestyle Preferences
The survey also dives into how hourly employees spend their time and money outside of the workplace. Among dining preferences, McDonald’s took the crown with nearly half of respondents (46.6 percent) citing the golden arches as one of their top three food chains, followed by Chick-Fil-A (39 percent), and Subway (34.6 percent). Walmart outpaced competitors as the preferred place to shop with 85.6 percent of hourly employees citing the big box retailer as one of their top places to shop, followed by Dollar General (38.6 percent), and Amazon (35.2 percent) eeking out Target (35.1 percent) for third.
For entertainment, Netflix was not only hourly workers’ favorite entertainment platform, but also the platform they most likely had a paid subscription for. While they listed YouTube as their second most beloved entertainment platform (69.3 percent) over Hulu (34.7 percent), respondents were more likely to pay for Hulu subscription than YouTube Premium. Snapchat was also listed as among their top five entertainment and social media platforms. Among social media platforms, Facebook edged out Instagram for top spot (78.2 percent vs. 77.2 percent), with Snapchat (72.8 percent) following a close third. Twitter (20.8 percent) and Pinterest rounded out the list a distant fourth and fifth.
To view the full report, click here.
Gen Z in the Workplace
The Workforce Institute at Kronos Incorporated issued a global survey of 3,400 members of Generation Z1 across 12 countries that found contradictory revelations from the newest segment of workforce.
This survey is the first in a series of reports from The Workforce Institute at Kronos and Future Workplace that examines attitudes of Gen Z in workplaces across Australia, Belgium, Canada, China, France, Germany, India, Mexico, the Netherlands, New Zealand, the U.K., and the U.S., including how their education has prepared them for the working world, their perceptions about the gig economy, and their views on how to be an employer of choice for the next generation. Part one, “Meet Gen Z: Hopeful, Anxious, Hardworking, and Searching for Inspiration,” explores surprising contradictions of how 16- to 25-year-olds view themselves, their expectations of work, and how employers can best prepare to manage Gen Z employees.
News Facts
Gen Z believes it is the hardest-working generation – and have it the hardest – yet demand schedule flexibility to deliver their best work.
One-third (32 percent) of Gen Z respondents say they are the hardest-working generation ever, with Millennials ranked as the second-hardest working generation at 25 percent. More than half (56 percent) say the Silent Generation is the least hardworking generation of all time.
Almost two-fifths (36 percent) of Gen Zers believe they “had it the hardest” when entering the working world compared to all other generations before it, tied with the Silent Generation (ages 75-94), which generally began entering the workforce during or just after World War II.
While Gen Zers believe they are hardworking, one in four (26 percent) admit they would work harder and stay longer at a company that supports flexible schedules, with flexibility desired most in Canada (33 percent), the U.K. (31 percent), and the U.S. (31 percent).
Gen Z’s appeal for flexibility comes with a few actions they would never tolerate from their employer, including being forced to work when they don’t want to (35 percent); inability to use vacation days when they want to (34 percent); and working back-to-back shifts (30 percent).
Mind the “Preparation Gap”: Gen Z outlines what school did – and did not – prepare them for, as these digital natives crave face-to-face interaction.
Despite record-high enrollment, less than half of Gen Z credits their high school (39 percent) or college (42 percent) education for preparing them to enter the working world. One in four Gen Zers say they are least prepared to handle negotiating (26 percent); networking (24 percent); speaking confidently in front of crowds (24 percent); and resolving work conflict (23 percent).
Conversely, Gen Z feels well-equipped to handle working in a team (57 percent); hitting project deadlines (57 percent); and working with customers (56 percent).
Gen Z also isn’t prepared to be managed by another person (21 percent), although nearly one-third (32 percent) say they would be motivated to work harder and stay longer at a company if they have a supportive manager. The top three attributes they value in a manager are: “they trust me” (47 percent), “they support me” (40 percent), and “they care about me” (35 percent).
Despite being digital natives, three out of four Gen Zers (75 percent) prefer to receive manager feedback in person, and 39 percent prefer to communicate with their team or employer in person – with Gen Zers in Mexico valuing in-person communication the most (55 percent).
How do they measure success? Gen Z is optimistic, yet anxious, about their careers.
Across the globe, more than half (56 percent) of Gen Z is optimistic about their professional future, led by India where an incredible 44 percent of 16- to 25-year-olds are “extremely optimistic,” followed closely by U.S. Gen Zers at 31 percent.
However, Gen Zers who are employed today are the least optimistic: Half (50 percent) of those who are currently serving in an internship and one-third (28 percent) of those working full-time are only “moderately” optimistic about their professional future.
The overall optimism of Gen Z is met with many emotional barriers this generation feels it must overcome to achieve workplace success, including anxiety (34 percent), lack of motivation/drive (20 percent), and low self-esteem (17 percent). Anxiety, specifically, is a greater concern among female Gen Zers (39 percent vs. 29 percent for male) and most prevalent in Canada (44 percent), the U.K. (40 percent), and the U.S. (40 percent).
About one-third of Gen Z measures their success based on how respected they are by their co-workers (34 percent) and the recognition they receive from their manager (32 percent). However, traditional benchmarks still matter, with salary (44 percent) and advancement (35 percent) reigning supreme.
Personalization in Digital Food Retail
The fast-changing dynamics of the food retailing environment continue to challenge companies to keep pace with fast-changing shopper demands. The latest of these shifting shopper requirements involves their behavior on digital platforms and is creating an imperative for grocers to compete across all shopper touchpoints, digital and in stores.
New research conducted by IDC Retail Insights and commissioned by Precima, published in the IDC InfoBrief, Personalization in Digital Food Retail – Shoppers Expect More, casts light on the current state of digital food retailing and what food retailers need to do now to drive success. The research shows that while Amazon.com continues to be a primary disruptive influence in fast moving consumer goods retailing, they struggle with retaining food shoppers. Another opportunity for grocery retailers revealed is that shopping exclusively online is still relatively rare, so optimizing in-store experiences can help retain customers who might otherwise prefer digital options. A recent survey from Food Marketing Institute (FMI) confirms this opportunity, revealing that by 2022 consumers could be spending $100 billion a year on online grocery.
“Retailers have finite resources that are shared among competing merchandising, operational and marketing priorities. They need to make smart decisions about where to invest in digital capabilities and how those capabilities and business decisions fit in with the rest of the organization,” said Brian Ross, CEO of Precima, a global retail strategy, analytics and cloud software company that provides data-driven solutions to retailers. “The successful retailers are rapidly developing and deploying digital capabilities to compete more aggressively. Our new research separates facts from hype and discloses the tactics that are paying off today and will pay off tomorrow.”
“Consumer expectations require grocery retailers to implement new customer experience models and technology architecture,” said Ivano Ortis, Vice President, IDC Retail, Manufacturing, Financial Insights. “Investing in advanced analytics, personalized offers, and localized assortment optimization, while adapting the store format to shoppers’ behavior, will allow grocery retailers to achieve short-term success.”
Additional key findings from the research include:
- 63 percent of shoppers say personalization is important
- 35 percent of shoppers will spend 26 percent-40 percent of their grocery budget online by 2020
- A Personalized Customer Experience strategy is a clear opportunity for brand differentiation
- Consumers expect a seamless experience throughout in-store and online journeys
- Personalized offers are vital for ecommerce; shopping/wish lists are an opportunity to enhance shopper experience and loyalty
- Retailers expect major disruption in the next three years, from operations automation, retail commerce platforms, and added-value shopper services
The data in the Personalization in Digital Food Retail – Shoppers Expect More InfoBrief comes from a web-based survey of more than 4,000 consumers and 444 retailers in North America, France, Italy, Spain and United Kingdom between November and December 2018.